You log into Google Ads. Then Facebook. Then your website analytics. Then your CRM. An hour later, you’re staring at a spreadsheet full of numbers that somehow tell you everything and nothing at the same time. Your ad spend is up, your impressions look good, and you got plenty of clicks—but are you actually making money? That’s the question keeping business owners up at night, and it’s the exact problem marketing dashboards and reporting are designed to solve.
The frustration isn’t about lacking data. You’re drowning in it. The problem is that all those numbers live in different places, speak different languages, and rarely connect to the one thing that actually matters: revenue. Without a centralized view that ties marketing activity directly to business results, you’re essentially flying blind with a very expensive plane.
Marketing dashboards transform this chaos into clarity by creating a single source of truth. Instead of hunting through multiple platforms to piece together your performance, you get one unified view that shows exactly where your money is going and what it’s bringing back. This isn’t about prettier graphs—it’s about finally knowing whether your marketing is working.
The Anatomy of a Marketing Dashboard That Actually Works
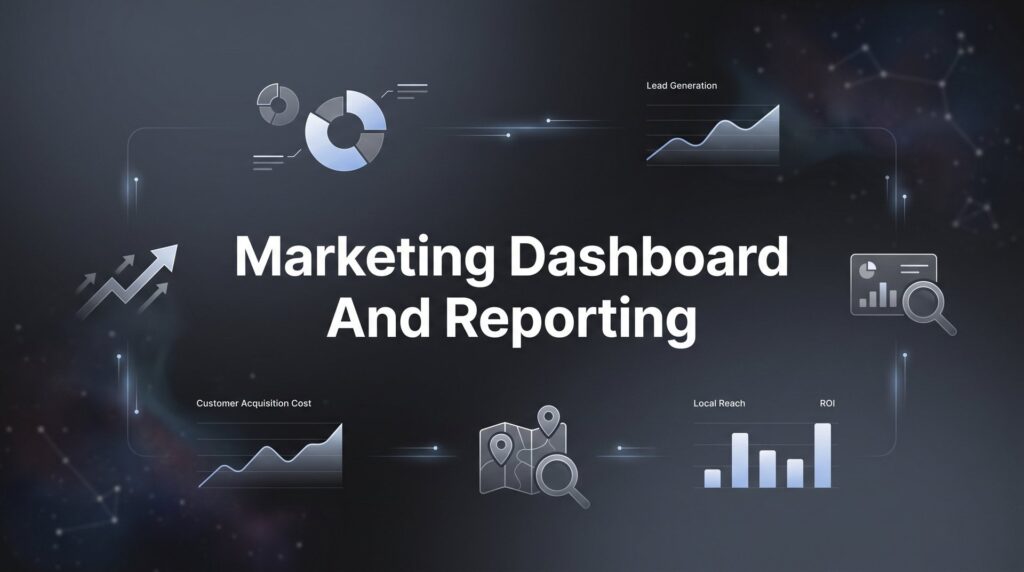
A marketing dashboard is a centralized visual display that pulls data from multiple sources into one unified view. Think of it as your marketing command center—the place where Google Ads performance, Facebook campaign results, website conversions, and CRM data all come together to tell a complete story.
But here’s where most dashboards fail: they show you everything without helping you understand anything. The difference between a dashboard that wastes your time and one that drives decisions comes down to what it measures.
Vanity Metrics vs. Actionable Metrics: Your dashboard might show impressive impression counts and growing follower numbers, but those vanity metrics rarely connect to revenue. What actually matters? Cost per lead, conversion rates, customer acquisition costs, and revenue attribution. These actionable metrics tell you whether your marketing investment is profitable or just expensive.
The most effective dashboards focus relentlessly on metrics that influence decisions. If a number doesn’t help you decide where to spend more, where to cut back, or what to test next, it’s just noise. Understanding performance marketing principles helps you identify which metrics actually drive business outcomes.
Real-Time Data Feeds: Marketing moves fast. A campaign that’s crushing it on Monday might be hemorrhaging money by Wednesday. Real-time data synchronization means you’re looking at current performance, not yesterday’s news. This matters especially for paid advertising where budget can disappear quickly if something goes wrong.
Customizable Visualizations: Different questions need different views. Sometimes you need a line graph showing trend over time. Other times you need a breakdown by channel or a comparison against your goals. The ability to customize how data displays ensures you can quickly spot patterns, anomalies, and opportunities without digging through raw numbers.
Goal Tracking and Benchmarks: Numbers without context are meaningless. Is a 3% conversion rate good or terrible? It depends on your industry, your offer, and your goals. Effective dashboards let you set benchmarks and track progress against specific targets, turning abstract numbers into clear signals about whether you’re winning or losing.
Alert Systems: You can’t monitor your dashboard 24/7, but your dashboard can monitor itself. Automated alerts notify you when metrics fall outside acceptable ranges—when cost per lead spikes, when conversion rates drop, or when a campaign stops delivering. This early warning system catches problems before they drain your budget and flags opportunities before your competitors notice them.
Essential Metrics Every Local Business Should Track
Not all metrics deserve space on your dashboard. Local businesses need to focus on the numbers that directly connect marketing spend to business outcomes. Here are the non-negotiables.
Customer Acquisition Cost (CAC): This is the total cost of turning a stranger into a paying customer. Calculate it by dividing your total marketing spend by the number of new customers acquired in that period. If you spent $5,000 on marketing last month and gained 50 new customers, your CAC is $100.
Why does this matter so much? Because it tells you whether your business model is sustainable. If it costs you $100 to acquire a customer who only spends $80 with you, you’re going out of business one sale at a time. Knowing your CAC lets you make intelligent decisions about how much you can afford to spend on acquisition and which channels deliver customers at a profitable cost.
Many businesses track cost per lead but never calculate the full acquisition cost. That’s a dangerous gap. A $20 lead might look great until you realize only one in ten leads becomes a customer—suddenly your real CAC is $200, not $20. If you’re struggling with this issue, you may be dealing with poor quality leads from marketing that inflate your true acquisition costs.
Lead-to-Customer Conversion Rates by Channel: Not all leads are created equal. The person who fills out a contact form after reading your blog post behaves differently than someone who clicked a Facebook ad offering 50% off. Understanding conversion rates by source reveals which channels deliver buyers versus browsers.
Track this metric separately for each marketing channel: Google Ads, Facebook, organic search, referrals, email campaigns. You might discover that Google Ads generates three times as many leads as Facebook, but Facebook leads convert to customers at twice the rate. That insight completely changes how you should allocate budget.
This is where many businesses lose money. They see high lead volume from a channel and keep feeding it budget without realizing those leads rarely convert. Meanwhile, a smaller channel with better conversion rates gets ignored because it doesn’t generate impressive lead counts.
Return on Ad Spend (ROAS): ROAS measures revenue generated for every dollar spent on advertising. A ROAS of 5:1 means you’re generating $5 in revenue for every $1 in ad spend. This metric directly answers the question every business owner asks: “Am I making money on this?”
Calculate ROAS by dividing revenue attributed to your ads by the amount spent on those ads. If you spent $2,000 on Google Ads and those ads generated $10,000 in revenue, your ROAS is 5:1.
Here’s the critical piece: ROAS requires revenue attribution. You need to connect closed deals back to the marketing source that generated them. This is where many reporting systems break down—they can tell you how many leads came from each channel but not which leads actually bought.
Revenue Attribution: This is the process of connecting marketing dollars to actual sales. When someone becomes a customer, can you trace them back to their original source? Did they come from a Google Ad? An organic search? A Facebook campaign?
Without attribution, you’re making decisions based on incomplete information. You might be pouring money into channels that generate lots of activity but few sales, while underfunding the channels that actually drive revenue. Implementing call tracking for marketing campaigns is essential for capturing phone leads that often get missed in digital attribution.
Effective attribution requires integration between your marketing platforms and your sales system. When a lead converts to a customer, that information needs to flow back to your dashboard so you can see the complete journey from first click to closed deal.
Building Your Reporting Framework: From Raw Data to Business Decisions
Having the right metrics is only half the battle. How you organize and review that data determines whether it drives action or just creates more work. Effective reporting operates on three distinct levels, each serving a different purpose.
Daily Pulse Checks: These are quick scans to catch anomalies and urgent issues. You’re not doing deep analysis—you’re looking for red flags. Did cost per lead suddenly spike? Did a campaign stop delivering? Is traffic down significantly?
Daily monitoring should take five to ten minutes maximum. You’re checking vital signs, not performing surgery. Set up your dashboard to highlight anything that falls outside normal ranges so problems jump out immediately. The goal is early detection, not detailed investigation.
Weekly Performance Reviews: This is where you make tactical adjustments. Look at performance trends over the past seven days. Which campaigns are winning? Which are underperforming? Where should you shift budget?
Weekly reviews inform immediate optimization decisions. Maybe you pause a Facebook campaign that’s driving expensive leads and reallocate that budget to Google Ads where cost per lead is lower. Perhaps you increase bids on keywords that are converting well. These are the adjustments that keep your marketing efficient week to week.
Structure your weekly review around specific questions: What’s working better than expected? What’s worse than expected? What changed from last week? What should we test next?
Monthly Strategic Analysis: Once a month, step back and look at the bigger picture. How did this month compare to last month? Are you on track to hit quarterly goals? What patterns are emerging over time?
Monthly analysis informs strategic decisions about budget allocation, channel mix, and campaign direction. This is when you might decide to explore a new marketing channel, significantly increase investment in a proven winner, or completely overhaul an underperforming approach. Many businesses find it helpful to book a marketing strategy session to get expert perspective on their monthly data.
The monthly review should also include profitability analysis. Don’t just look at marketing metrics—connect them to business outcomes. Are you acquiring customers profitably? Is your customer lifetime value growing? How does this month’s CAC compare to your targets?
Structuring Reports for Different Stakeholders: The business owner needs different information than the marketing team. Owners care about bottom-line impact: Are we making money? What’s our ROI? Should we increase or decrease marketing spend?
The marketing team needs operational detail: Which keywords are performing? What ad creative is winning? Where should we focus optimization efforts?
Create separate report views for each audience. Executive dashboards should focus on high-level metrics tied to revenue and profitability. Operational dashboards can include more granular data about campaign performance, audience behavior, and optimization opportunities.
Moving from Description to Prescription: The weakest reports simply describe what happened. Traffic was up 15%. Cost per lead decreased by $3. Conversion rate held steady at 2.8%. So what?
Strong reports turn data into recommendations. Traffic increased 15% because we shifted budget to higher-performing keywords—we should accelerate that shift. Cost per lead dropped because we refined our audience targeting—let’s apply the same approach to other campaigns. Conversion rate plateaued despite traffic growth—we need to test new landing page variations.
Every report should answer: What happened? Why did it happen? What should we do about it? That third question transforms reporting from a historical record into a strategic tool.
Common Dashboard Mistakes That Hide Your True ROI
Even with good intentions, many businesses build dashboards that obscure rather than reveal performance. Here are the traps that keep you from seeing the truth about your marketing ROI.
Tracking Too Many Metrics: When everything is important, nothing is important. Dashboards cluttered with dozens of metrics create the illusion of comprehensive tracking while making it impossible to focus on what actually drives results.
The solution isn’t more data—it’s ruthless prioritization. Identify the five to seven metrics that most directly connect to revenue and profitability. Those are your dashboard stars. Everything else is supporting data you can reference when needed but shouldn’t monitor constantly.
Ask yourself: if this metric changed dramatically, would it change what I do? If the answer is no, it doesn’t belong on your primary dashboard.
The Attribution Gap: This is the most expensive mistake in marketing reporting. You track leads, you track ad spend, but you never connect them to actual sales. You know 100 leads came from Google Ads, but you have no idea how many of those leads became customers.
Without attribution, you’re optimizing for the wrong thing. You might be investing heavily in channels that generate lots of leads but few sales, while neglecting channels with lower lead volume but higher conversion rates. If this sounds familiar, you’re likely not tracking marketing conversions properly—a fixable problem with the right approach.
Closing this gap requires integration between your marketing tools and your sales system. Whether that’s a CRM, a spreadsheet, or a point-of-sale system, you need a way to mark which leads became customers and trace them back to their original source.
Platform-Native Dashboard Tunnel Vision: Google Ads tells you your campaigns are performing great. Facebook says their platform is driving excellent results. Your website analytics show strong engagement. But somehow your bank account doesn’t reflect all this success.
Platform-native dashboards are designed to make their platform look good. Google Ads will emphasize clicks and conversions within their ecosystem but won’t tell you those conversions never turned into paying customers. Facebook celebrates engagement and reach while glossing over the fact that none of those engaged users bought anything.
Unified dashboards that pull data from all sources reveal the full picture. You might discover that Google Ads drives more conversions but Facebook delivers better customer quality. Or that organic search generates fewer leads but converts at three times the rate of paid channels. These insights only emerge when you see all your data together.
Static Benchmarks: Setting goals is good. Never updating them is dangerous. Market conditions change, competition shifts, and your business evolves. A cost per lead that was acceptable six months ago might be unsustainable today.
Review and adjust your benchmarks quarterly. What’s your current customer lifetime value? How has your close rate changed? What are competitors spending to acquire customers in your market? Use these factors to set realistic, current targets rather than clinging to outdated assumptions.
Turning Reports Into Revenue: How to Act on Your Data
Data without action is just expensive entertainment. The real value of marketing dashboards and reporting comes from what you do with the insights they provide. Here’s how to turn information into revenue.
Identifying Underperformers Before They Drain Your Budget: Your dashboard should make it immediately obvious when something isn’t working. Maybe it’s a campaign with a cost per lead that’s twice your target. Or a keyword group that’s generating clicks but zero conversions. Or an audience segment that engages with ads but never completes a purchase.
Set clear performance thresholds for each metric. When cost per lead exceeds your maximum acceptable cost, pause the campaign. When a channel’s conversion rate drops below your minimum threshold, investigate immediately. Don’t wait for month-end reviews to catch problems—by then, you’ve already wasted budget. Understanding why marketing campaigns aren’t generating revenue helps you diagnose issues faster.
Automated alerts are crucial here. Configure your dashboard to notify you when metrics fall outside acceptable ranges. This early warning system catches problems in hours or days instead of weeks.
Recognizing and Scaling Winning Patterns: Success leaves clues in your data. Maybe you notice that leads from organic search convert at twice the rate of paid search. Or that campaigns targeting a specific geographic area deliver significantly lower cost per acquisition. Or that certain ad creative consistently outperforms everything else.
When you identify a winning pattern, the right response is aggressive scaling. If a particular campaign is delivering customers at half your target CAC, that’s not the time to maintain current spend—it’s the time to double down. Increase budget, expand to similar audiences, and replicate the approach across other campaigns.
Many businesses make the mistake of treating all campaigns equally. They spread budget evenly instead of concentrating resources on proven winners. Your dashboard should make winners and losers obvious so you can shift investment accordingly. If you’re finding it hard to grow what’s working, you may be experiencing the common challenge of finding it difficult to scale marketing efforts.
Setting Up Intelligent Alert Systems: You can’t watch your dashboard constantly, but you can configure it to watch itself. Automated alerts turn your dashboard into an active monitoring system that catches both problems and opportunities.
Set alerts for critical thresholds: cost per lead exceeding your maximum, conversion rates dropping below acceptable levels, daily spend pacing above or below targets, campaign performance deviating significantly from historical averages.
But don’t just alert on problems—alert on opportunities too. When a campaign suddenly starts performing better than expected, you want to know immediately so you can capitalize on it. When a new traffic source starts driving qualified leads, catch it early so you can scale before competitors notice.
The goal is responsive marketing. Instead of waiting for scheduled reviews to discover what happened last week, you’re reacting to performance in real-time, catching problems before they escalate and seizing opportunities before they disappear.
The Bottom Line: Control, Not Just Data
Marketing dashboards and reporting aren’t about collecting more data—you already have plenty of that. They’re about gaining control. Control over where your money goes. Control over what’s working and what’s not. Control over decisions that used to feel like guesses.
The transformation from drowning in disconnected metrics to having a clear, unified view of performance changes everything. Instead of hoping your marketing is working, you know. Instead of wondering which channels deliver results, you can see exactly where every dollar goes and what it returns.
This clarity compounds over time. Every week, you make slightly better decisions about budget allocation. Every month, you identify and scale winning patterns faster. Every quarter, you’re further ahead of competitors who are still flying blind.
But building an effective reporting system requires more than just connecting tools and creating graphs. It requires knowing which metrics actually matter for your business, understanding how to structure data for different decision types, and having the discipline to act on insights rather than just admiring them.
For many local businesses, the gap between having data and having actionable insights feels impossible to bridge. You know reporting matters, but between running your business and managing day-to-day operations, building a sophisticated dashboard system keeps getting pushed to next month.
That’s exactly where professional guidance makes the difference. If you want to see what this would look like for your business, we’ll walk you through how a properly structured reporting system reveals exactly what’s driving revenue and what’s wasting money. No more guessing whether your marketing is working. No more logging into five different platforms trying to piece together the story. Just clear visibility into what matters and what to do about it.