You’re watching your Google Ads dashboard, and something doesn’t add up. Your competitor is running ads for the same keywords, appearing in similar positions, yet somehow they’re paying significantly less per click. You’ve increased your bids, tweaked your budget, even tried different times of day—but your costs keep climbing while their ads keep showing. The frustration builds as you wonder: what am I missing?
The answer is Quality Score—Google’s invisible scoring system that acts like a credit rating for your ads. Just as someone with excellent credit gets better interest rates on loans, advertisers with high Quality Scores pay less for the same ad positions. This isn’t a minor difference we’re talking about. The gap between a mediocre Quality Score and a strong one can mean the difference between profitable campaigns and watching your budget evaporate without results.
Here’s what makes this particularly important: Quality Score operates behind the scenes of every auction, every time someone searches for your keywords. It’s recalculating, adjusting, and determining your costs in real-time. Most business owners have no idea this system exists, let alone how to work with it instead of against it. By the time you finish this article, you’ll understand exactly how Quality Score works, why it has such a dramatic impact on your advertising costs, and the specific steps you can take to improve it—potentially cutting your cost-per-click by 30-50% without sacrificing ad position.
The Three Pillars That Determine Your Quality Score
Google evaluates your ads using three distinct components, each carrying equal weight in your overall Quality Score. Think of these as the three legs of a stool—weakness in any one area makes the entire structure unstable.
Expected Click-Through Rate (CTR): This measures how likely Google thinks users are to click your ad when it appears for a specific keyword. Google bases this prediction on your keyword’s historical performance, how well your ad has performed for similar searches in the past, and the overall competitiveness of the keyword. If your ad consistently gets clicked when it shows up, Google interprets this as a signal that your ad is relevant and useful to searchers.
What makes CTR particularly interesting is that Google compares your performance against other advertisers competing for the same keywords. You’re not just being scored in isolation—you’re being measured against the market. An ad with a 3% CTR might seem decent until you realize competitors are achieving 6% for the same search terms. Google notices this gap and adjusts your Expected CTR rating accordingly.
Ad Relevance: This component examines how closely your ad copy matches the searcher’s intent behind the keyword. When someone searches for “emergency plumber Chicago,” they’re looking for immediate help with a plumbing crisis in a specific location. If your ad talks about “affordable plumbing services nationwide” or focuses on scheduled maintenance, there’s a disconnect between what the searcher wants and what you’re offering.
Google’s algorithm has become remarkably sophisticated at understanding search intent. It can distinguish between someone researching options (“best running shoes for beginners”) and someone ready to buy (“buy Nike Pegasus 40 size 10”). Your ad relevance score reflects how well your messaging aligns with where the searcher is in their decision journey. Generic ads that try to appeal to everyone typically score poorly here, while tightly focused ads that speak directly to the searcher’s specific need score well.
Landing Page Experience: After someone clicks your ad, Google evaluates what happens next. The landing page experience component considers multiple factors: how fast your page loads, whether it’s mobile-friendly, how relevant the content is to both the ad and the search query, how easy it is to find what you promised in the ad, and whether the page provides a good overall user experience.
This is where many advertisers stumble. They invest time crafting the perfect ad copy, then send all traffic to their homepage or a generic services page. Google penalizes this mismatch. If your ad promises “free shipping on orders over $50,” but visitors land on a page where that offer isn’t immediately visible, your landing page experience score drops. Similarly, if your page takes eight seconds to load on mobile devices, or if it’s cluttered with pop-ups and difficult navigation, Google downgrades your score regardless of how relevant the content might be.
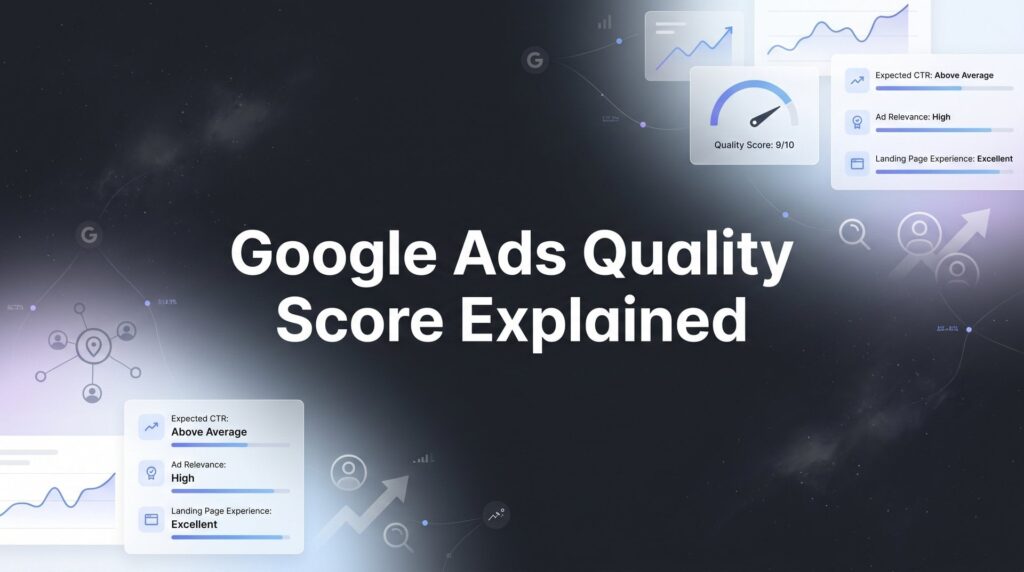
Each component receives its own rating: Below Average, Average, or Above Average. These ratings combine to create your overall Quality Score on a 1-10 scale. The key insight here is that you can’t compensate for weakness in one area by excelling in another. A fantastic landing page won’t fully offset poor ad relevance. You need solid performance across all three pillars to achieve the Quality Scores that dramatically reduce your advertising costs.
How Quality Score Directly Impacts Your Advertising Costs
Understanding the mechanics of how Quality Score affects your costs requires looking at Google’s Ad Rank formula. Every time someone searches for your keyword, Google runs an auction to determine which ads appear and in what order. Ad Rank determines your position, and it’s calculated by multiplying your maximum bid by your Quality Score (plus other factors like ad extensions and auction-time signals).
Here’s where the math gets interesting. Let’s say you’re willing to pay up to $5 per click for a keyword, and your Quality Score is 5. Your Ad Rank is 25. Your competitor bids only $3 per click, but they have a Quality Score of 8. Their Ad Rank is 24. Despite bidding 40% less than you, they’re in nearly the same competitive position. But the real kicker comes when Google calculates what you actually pay.
Google doesn’t charge you your maximum bid. Instead, you pay just enough to beat the advertiser below you. With a higher Quality Score, you can maintain your position while paying significantly less per click. Using the same example, if you improve your Quality Score from 5 to 8, you could reduce your bid to $3.13 and maintain the exact same Ad Rank of 25—saving nearly $2 per click.
Let’s put real numbers to this. Suppose you’re running a campaign that generates 1,000 clicks per month. At $5 per click with a Quality Score of 5, you’re spending $5,000 monthly. Improve that Quality Score to 8, and you could achieve the same results for approximately $3,125—a savings of $1,875 per month, or $22,500 annually. These aren’t theoretical savings. This is money that stays in your business instead of going to Google. For more strategies on how to reduce Google Ads cost, understanding Quality Score is essential.
The impact compounds over time because lower costs enable you to do more with the same budget. Those savings can fund additional keywords, extended campaign hours, or testing new ad variations. More traffic generates more data, which enables better optimization decisions. Better optimization improves performance, which improves Quality Score further, which reduces costs even more. You enter a virtuous cycle where success builds on success.
Conversely, poor Quality Scores create a vicious cycle. Higher costs mean fewer clicks for your budget. Fewer clicks mean less data and slower optimization. Limited data makes it harder to identify what’s working. Meanwhile, competitors with better Quality Scores are gathering more data, optimizing faster, and pulling further ahead while spending less. The gap widens not because they have bigger budgets, but because they’re playing the game more efficiently.
Diagnosing Your Quality Score Problems
Before you can fix Quality Score issues, you need to know where to look and what you’re looking at. Inside your Google Ads account, navigate to the Keywords tab within any campaign. By default, Quality Score columns aren’t visible, so you’ll need to add them. Click the Columns icon, select “Modify columns,” then under the Quality Score section, add “Quality Score” along with the three component scores: “Landing Page Exp.,” “Exp. CTR,” and “Ad Relevance.”
Once you’ve added these columns, you’ll see a 1-10 score for each keyword, along with status indicators for each component. These indicators—”Below Average,” “Average,” and “Above Average”—tell you specifically where your weaknesses lie. This granular data is critical because it prevents you from wasting time fixing the wrong things.
Let’s walk through some common diagnostic patterns. If you see a keyword with “Below Average” Expected CTR but “Average” or “Above Average” ratings for ad relevance and landing page experience, your problem is clear: your ads aren’t compelling enough to earn clicks. People are seeing your ad, but they’re choosing competitors instead. This suggests you need more attention-grabbing headlines, stronger calls-to-action, or better use of ad extensions to make your listing more prominent.
Now flip that scenario. If you have “Above Average” Expected CTR but “Below Average” landing page experience, you’re getting people to click, but disappointing them after they arrive. This pattern often indicates a mismatch between your ad promises and your landing page delivery, or technical issues like slow load times. The fix here isn’t better ad copy—it’s improving what happens after the click.
When you see “Below Average” ad relevance specifically, Google is telling you there’s a disconnect between your keyword and your ad copy. This frequently happens when you’re using broad match keywords or when you’ve grouped too many different keywords into a single ad group. Someone searching for “red leather sofas” sees your generic ad about “quality furniture for every room,” and Google recognizes the mismatch even if you don’t. If you’re struggling with this issue, our Google Ads Quality Score too low guide provides targeted solutions.
Pay special attention to keywords with Quality Scores of 3 or below. These are actively hurting your account performance. Not only are you paying premium prices for these keywords, but their poor performance can influence how Google evaluates new keywords you add to your account. Sometimes the best decision is to pause these keywords entirely rather than trying to rehabilitate them—contrary to popular belief, pausing low-quality keywords won’t harm your account-level health.
One important nuance: the Quality Score you see in your dashboard is a snapshot, not a real-time score. Google recalculates Quality Score every time your keyword matches a search query, but the number displayed in your interface updates less frequently. This means you might make improvements today that won’t fully reflect in your visible Quality Score for days or even weeks. Don’t panic if you don’t see immediate changes—the auction-time Quality Score is what actually matters for your costs, and that responds faster than the reported score.
Practical Strategies to Boost Each Quality Score Component
Improving Expected CTR starts with making your ads impossible to ignore. The most effective approach is creating tighter ad groups with hyper-relevant messaging. Instead of grouping 20 related keywords into one ad group with generic ads, break them into smaller groups of 3-5 closely related keywords. This allows you to craft ad copy that speaks directly to each specific search.
Your headlines are your primary weapon here. Google displays up to three headlines in expanded text ads, and you should use all three strategically. Include your exact keyword in at least one headline—this creates strong visual relevance when it appears bolded in the search results. Use another headline to highlight your unique value proposition: what makes you different from the eight other advertisers on the page? The third headline can address objections, mention promotions, or create urgency.
Ad extensions significantly impact CTR by making your ad larger and more prominent on the page. Sitelink extensions add additional clickable links below your ad. Callout extensions let you highlight features or benefits. Structured snippets showcase specific aspects of your products or services. Call extensions add a phone number. Location extensions show your address. Use every relevant extension type—they cost nothing extra and can increase your CTR by 10-15% or more simply by occupying more visual real estate.
For ad relevance improvements, the single keyword ad group (SKAG) approach takes the tight ad group concept to its logical extreme. You create an ad group containing just one keyword in all match types (exact, phrase, broad match modifier), then write ads specifically for that one keyword. This ensures perfect alignment between search query, keyword, and ad copy. While managing dozens of single-keyword ad groups requires more work, the Quality Score improvements often justify the effort for your highest-value keywords. Our comprehensive Google Ads optimization guide covers these techniques in detail.
Dynamic keyword insertion can help at scale, but use it carefully. This feature automatically inserts the searcher’s query into your ad headline or description. When someone searches “blue running shoes,” they see an ad with “blue running shoes” in the headline. This creates strong relevance signals, but it can also produce awkward or inappropriate ad copy if your keyword list isn’t tightly controlled. Test it cautiously on a subset of keywords before rolling it out broadly.
Landing page experience requires both technical and content improvements. Start with speed. Use Google’s PageSpeed Insights tool to identify what’s slowing down your pages. Compress images, minimize code, enable browser caching, and consider a content delivery network if you’re serving users across wide geographic areas. Even a one-second improvement in load time can meaningfully impact your Quality Score and conversion rates.
Message match is equally critical. If your ad promises “free consultation for first-time customers,” those exact words should appear prominently above the fold on your landing page. The visitor should see immediate confirmation that they’re in the right place. Use consistent language, imagery, and offers between your ad and landing page. Inconsistency creates friction and signals to Google that your landing page isn’t delivering what your ad promised.
Your call-to-action should be crystal clear and easy to complete. Visitors shouldn’t have to hunt for how to take the next step. Use contrasting colors for buttons, minimize form fields to only essential information, and remove navigation elements that might distract from your primary conversion goal. Google evaluates how easy it is for users to accomplish what they came to do—make it effortless.
Mobile experience deserves special attention because Google evaluates mobile landing page experience separately for mobile searches. Test your pages on actual mobile devices, not just in a desktop browser’s responsive mode. Buttons should be large enough to tap easily, text should be readable without zooming, and forms should use mobile-friendly input types. If your mobile experience is subpar, you’re being penalized every time someone searches on their phone—which is the majority of searches in most industries.
Quality Score Myths That Waste Your Time and Budget
Let’s clear up some persistent misconceptions that lead advertisers to make poor decisions or waste effort on the wrong priorities.
Myth: Pausing low-performing keywords will hurt your account Quality Score. Many advertisers keep terrible keywords active because they fear pausing them will damage their account-level quality. This isn’t how the system works. Google doesn’t calculate an account-wide Quality Score that gets hurt when you pause bad keywords. Each keyword has its own Quality Score, and pausing a keyword simply removes it from consideration. In fact, pausing keywords with Quality Scores of 3 or below often improves your account’s overall performance because you stop wasting budget on expensive, ineffective traffic.
Myth: Quality Score updates instantly when you make changes. You’ve optimized your landing page, rewritten your ads, and tightened your keyword targeting. You check your Quality Score the next day and… nothing has changed. Frustration sets in. The reality is that Google’s Quality Score updates require time and data. The system needs to see how your changes perform across multiple auctions and user interactions before adjusting your score. Expect a lag of several days to a few weeks before your visible Quality Score reflects improvements, though the auction-time score that determines your actual costs responds somewhat faster.
Myth: You should aim for a perfect 10/10 on every keyword. While a Quality Score of 10 sounds ideal, chasing perfection on every keyword is neither realistic nor optimal. Quality Scores of 7-8 typically provide most of the cost benefits without requiring the extreme optimization effort needed to reach 9 or 10. Additionally, some keywords are inherently difficult to score well on due to high competition or commercial intent. A Quality Score of 6 on a high-value keyword that drives profitable conversions is better than a 9 on a low-value keyword that doesn’t generate business results.
Focus your optimization efforts where they’ll have the biggest impact: keywords with decent search volume, commercial intent, and current Quality Scores in the 4-6 range. These are your best opportunities for meaningful improvement. Keywords already at 8 or above are performing well—optimize them if you have extra capacity, but don’t neglect worse-performing keywords in pursuit of marginal gains. For a deeper dive into improving Google Ads Quality Score, focus on these mid-range opportunities first.
Another common misunderstanding involves conversion rates. Many advertisers assume Quality Score incorporates conversion rate, but it doesn’t—at least not directly. Quality Score focuses on relevance and user experience signals that Google can measure before a conversion happens: clicks, time on page, bounce rate. That said, landing pages that convert well typically also provide good user experiences, so there’s often correlation between high Quality Scores and strong conversion rates, even though one doesn’t directly cause the other.
Putting Quality Score to Work for Your Business
Now that you understand how Quality Score works and how to improve it, the question becomes: where do you start? Trying to optimize every keyword simultaneously leads to scattered efforts and minimal results. You need a prioritization framework.
Begin with your highest-spending keywords that have Quality Scores below 7. These represent your biggest opportunity for cost savings. A keyword that costs you $500 monthly with a Quality Score of 5 could potentially save you $150-200 per month if you improve it to a 7 or 8. Multiply that across your top 10-20 keywords, and you’re looking at substantial budget savings that can fund expansion or drop straight to your bottom line.
Next, look at keywords with high impression volume but low Quality Scores. These keywords are showing your ads frequently, which means there’s substantial search demand, but you’re paying premium prices for each click. Improving Quality Score here gives you more clicks from the same budget, which generates more data and enables faster optimization of your entire campaign.
Create a regular monitoring cadence. Check your Quality Score data weekly, but don’t obsess over minor fluctuations. Look for trends over time rather than day-to-day changes. Track your Quality Score improvements alongside business metrics that actually matter: cost per lead, conversion rate, return on ad spend. Quality Score is a means to an end—the end being profitable customer acquisition. If you’re generating traffic but struggling with poor quality leads from marketing, Quality Score optimization alone won’t solve that problem.
Some Quality Score problems signal deeper issues that require professional expertise. If you’ve implemented the strategies outlined here but your scores remain stubbornly low, you might be dealing with technical issues, account history problems, or competitive dynamics that require more sophisticated solutions. Similarly, if your Quality Scores are decent but your campaigns still aren’t profitable, the issue likely lies in conversion optimization, offer positioning, or market selection rather than Quality Score itself. Working with Google Ads management services can help identify and resolve these complex challenges.
The Bottom Line on Quality Score
Quality Score isn’t a vanity metric to obsess over—it’s a direct lever on your advertising profitability. The three components—Expected CTR, Ad Relevance, and Landing Page Experience—combine to determine how much you pay for every click. Improve your Quality Score from 5 to 8, and you can reduce your cost-per-click by 30-40% while maintaining or improving your ad positions.
The businesses winning with Google Ads aren’t necessarily those with the biggest budgets. They’re the ones who understand that Google rewards relevance and user experience with lower costs and better positions. They’ve built their campaigns around tight keyword grouping, compelling ad copy, and landing pages that deliver on their promises. They monitor their Quality Scores regularly but focus on the business outcomes those scores enable.
Start with the diagnostic steps outlined here. Identify your lowest-performing keywords and the specific component dragging down each score. Implement the targeted improvements most likely to move the needle: tighter ad groups for CTR, keyword-specific messaging for ad relevance, and speed plus message match for landing page experience. Give your changes time to take effect, then measure the impact not just on Quality Score but on your actual cost-per-click and conversion metrics.
Tired of spending money on marketing that doesn’t produce real revenue? We build lead systems that turn traffic into qualified leads and measurable sales growth. If you want to see what this would look like for your business, we’ll walk you through how it works and break down what’s realistic in your market. As a Google Premier Partner with deep expertise in both PPC and conversion rate optimization, we don’t just improve Quality Scores—we engineer profitable customer acquisition systems that scale with your business.