Every dollar you spend on marketing should pull its weight. But how do you know if it actually is? Most local business owners pour money into ads, SEO, and social media without a clear picture of what it truly costs to land a single new customer.
That’s where the customer acquisition cost formula comes in.
CAC is one of the most important metrics for understanding whether your marketing is profitable or quietly bleeding you dry. It tells you exactly how much you’re spending to win each new customer. When you track it correctly, it becomes the compass that guides every marketing decision you make.
Here’s the problem: most business owners either skip this calculation entirely or run it with incomplete numbers. The result? They make budget decisions based on gut feel instead of data, keep funding channels that aren’t working, and wonder why growth feels expensive and unpredictable.
In this step-by-step guide, you’ll learn how to calculate your customer acquisition cost formula from scratch, identify every expense that belongs in the equation, and use the result to make smarter spending decisions that drive real revenue. Whether you’re running Google Ads, investing in local SEO, or testing Facebook campaigns, this process works for any channel and any budget.
Let’s get your numbers dialed in.
Step 1: Define Your Measurement Window and Customer Definition
Before you touch a single number, you need to answer two questions: What counts as a new customer? And what time period are you measuring? Getting either of these wrong will make your CAC calculation misleading from the start.
Start with your customer definition. For a local service business, a “new customer” might mean someone who books their first appointment, signs a contract, or makes their first purchase. The key word is first. Returning clients and repeat buyers should be excluded from this count. If you lump them in, you’ll understate your CAC and think your marketing is performing better than it is.
This sounds obvious, but it trips people up constantly. A landscaping company might count a customer who came back for a second season as a “new” acquisition. A dental practice might count a returning patient who switched back after trying another provider. Be strict about your definition and document it so it stays consistent every time you run this calculation.
Next, choose your measurement window. The three most common options are monthly, quarterly, or annually. Consistency matters more than which one you pick. If you calculate CAC monthly one quarter and then annually the next, you can’t compare results meaningfully.
The right window depends on your sales cycle. If you run a quick-turnaround service where someone calls today and books tomorrow, monthly CAC tracking makes sense. But if you’re in home remodeling, legal services, or any business where the average prospect takes weeks or months to decide, a monthly window will distort your numbers. The marketing spend hits in one month, but the customer conversion shows up later. Use quarterly windows at minimum for longer sales cycles.
A quick practical tip: when in doubt, start with quarterly. It smooths out short-term fluctuations and gives you a more accurate picture of your true acquisition cost across the full buyer journey. If you’re new to this metric entirely, our guide on what is customer acquisition cost covers the foundational concepts in more detail.
Write down your definitions before moving to the next step. Something as simple as: “New customer = first paid transaction. Measurement window = Q1 2026 (January 1 through March 31).” That single sentence of clarity will save you hours of confusion later.
Step 2: Gather Every Sales and Marketing Expense
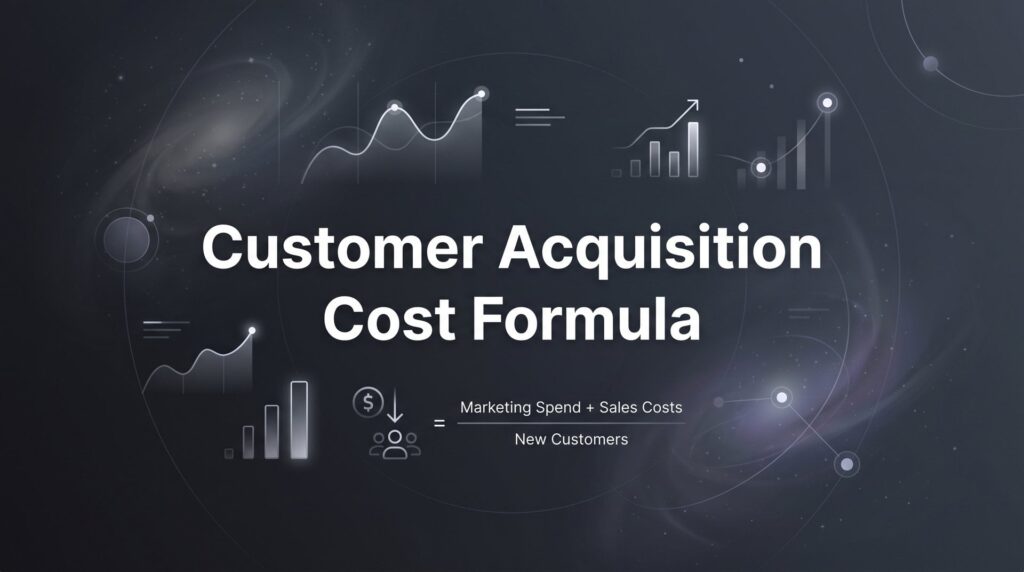
Here’s the formula at the core of everything:
CAC = Total Sales and Marketing Costs ÷ Number of New Customers Acquired
Simple on the surface. The complexity lives in that first number: “total sales and marketing costs.” Most business owners dramatically undercount this, and the result is a CAC that looks better than it actually is.
The most common mistake? Counting only ad spend. If you spent $3,000 on Google Ads and stopped there, you’ve missed half the picture. Here’s the full list of what needs to go into your cost calculation:
Paid Advertising: All ad spend across every platform. Google Ads, Facebook and Instagram Ads, YouTube, display networks, local directories, sponsored listings. Include every dollar of media spend.
Agency and Contractor Fees: If you work with a digital marketing agency, a freelance copywriter, a social media manager, or any external vendor involved in attracting or converting customers, those fees belong here.
Marketing Software and Tools: CRM subscriptions, email marketing platforms, landing page builders, call tracking software, analytics tools, SEO platforms. These are real costs that directly support customer acquisition.
Content Creation: Photography, video production, blog writing, graphic design. If it was created to attract or convert customers, it’s a marketing cost.
Sales Team Compensation: Salaries, hourly wages, commissions, and bonuses for anyone involved in closing new customers. This is the one most business owners forget entirely. If your sales process requires a human being, that human’s time has a cost.
Indirect Time Costs: This one requires some estimation. How many hours per week do you personally spend on sales calls, following up with leads, writing proposals, or attending networking events? Multiply those hours by a reasonable hourly rate for your time. It counts.
To track this cleanly, set up a simple spreadsheet with these columns: Expense Category, Vendor or Platform Name, Monthly Cost, and Notes. Run it for your defined measurement window and total everything up. For a deeper walkthrough of the math, see our resource on customer acquisition cost calculation.
Here’s what a basic version looks like for a single quarter:
Google Ads spend: $4,500
Facebook Ads spend: $1,200
Agency management fee: $1,500
CRM subscription: $150
Call tracking software: $75
Sales rep commission (new customers only): $800
Total: $8,225
That’s a very different number than the $5,700 in ad spend alone. And it’s the number that actually reflects what it cost your business to go out and get new customers during that period.
Take the time to be thorough here. An undercount at this stage leads to overconfidence in your marketing performance, which leads to bad budget decisions down the road.
Step 3: Count Your New Customers Accurately
Your cost number is only half the equation. Now you need an accurate count of how many new customers you actually acquired during your measurement window. And “accurate” is doing a lot of work in that sentence.
The goal is to pull this number from a reliable system, not from memory or estimation. Your CRM, point-of-sale system, booking software, or invoicing platform should be your source of truth. If you’re not using any of these tools yet, that’s a problem worth solving before you go further, because guessing at customer counts makes your CAC calculation worthless.
When pulling your numbers, filter specifically for first-time customers within your measurement window. Most CRM platforms let you tag or segment new customers separately from returning ones. If yours doesn’t, you can often export a full customer list and sort by “first transaction date” to isolate new acquisitions. You can also use our customer acquisition cost calculator to speed up the math once you have your numbers ready.
One critical detail: count customers by when they converted, not when they first clicked an ad or filled out a form. A lead who clicked your Google Ad in December but didn’t sign a contract until February belongs in February’s count. Misattributing conversion timing is a common error that makes your CAC look artificially better in some months and worse in others.
A few tools that make this easier:
Google Analytics with conversion tracking: Shows you how many people completed a defined action (form submission, phone call, purchase) and what channel drove them there.
CRM reports: Platforms like HubSpot, Salesforce, or even simpler tools like Jobber or ServiceTitan (popular with local service businesses) let you filter customers by creation date and status.
Call tracking software: If phone calls are a primary conversion path for your business, tools like CallRail let you track which calls resulted in new customers and which channel drove each call.
The bottom line: garbage data in means garbage CAC out. Spending 30 minutes to pull clean, accurate customer counts is the difference between a number you can actually act on and a number that gives you false confidence. Don’t skip this step.
Step 4: Run the Customer Acquisition Cost Formula (With Real Examples)
Now you have both numbers. Time to do the math.
CAC = Total Sales and Marketing Costs ÷ Number of New Customers Acquired
Let’s walk through a clearly hypothetical example to make this concrete. Imagine a local plumbing company that spent $8,000 on all sales and marketing expenses in Q1 and acquired 40 new customers during that same period. Their CAC calculation looks like this:
$8,000 ÷ 40 = $200 CAC
Every new customer cost them $200 to acquire, on average. Now the question is: is $200 a good number or a bad number? We’ll get to that in the next step. First, let’s talk about how to make this calculation even more useful by breaking it down by channel.
The number above is called your blended CAC. It averages across all your marketing channels. Blended CAC is useful for getting a high-level view of your overall marketing efficiency, but it can mask serious problems. If one channel is generating customers for $80 each and another is generating them for $600 each, the blended number hides both the winner and the money pit.
That’s why channel-specific CAC is where the real insights live. To calculate it, isolate the spend and the customer count for each channel separately. Understanding which platforms deliver the best results is critical, and our breakdown of the best customer acquisition channels can help you evaluate where to focus.
Using our hypothetical plumbing company, let’s say their $8,000 broke down like this:
Google Ads: $5,000 spend, 30 new customers → $5,000 ÷ 30 = $167 CAC
Facebook Ads: $2,000 spend, 6 new customers → $2,000 ÷ 6 = $333 CAC
Local SEO and content: $1,000 spend, 4 new customers → $1,000 ÷ 4 = $250 CAC
Suddenly the picture is much clearer. Google Ads is the most efficient channel by a significant margin. Facebook is producing customers, but at twice the cost. Armed with this breakdown, the business owner can make an informed decision: put more budget into Google Ads, work on improving Facebook’s conversion rate, or reallocate that Facebook budget entirely.
That’s the power of channel-specific CAC. Use blended CAC for overall health checks. Use channel-specific CAC to make tactical budget decisions.
Step 5: Benchmark Your CAC Against Customer Lifetime Value
Here’s the truth most guides skip: your CAC number means almost nothing in isolation. A $200 CAC could be fantastic or catastrophic depending entirely on what a customer is actually worth to your business.
This is where Customer Lifetime Value, or LTV, enters the picture. LTV represents the total revenue you can expect from a single customer over the entire length of your relationship with them. Pair it with your CAC and you get one of the most powerful ratios in business: the LTV-to-CAC ratio.
To calculate a basic LTV, use this formula:
LTV = Average Revenue per Customer × Average Customer Lifespan
Back to our hypothetical plumbing company. Let’s say the average customer spends $600 per service call and comes back roughly twice a year for an average of three years. Their LTV looks like this:
$600 × 2 calls/year × 3 years = $3,600 LTV
Now compare that to the $200 CAC:
$3,600 ÷ $200 = 18:1 LTV-to-CAC ratio
That’s an exceptional ratio. For every dollar spent acquiring a customer, they generate $18 in lifetime revenue. The business has enormous room to increase marketing spend and still remain profitable. To see how your numbers stack up against industry standards, check out our guide on customer acquisition cost benchmarks.
A widely referenced benchmark in business strategy, popularized through work on growth metrics by practitioners like David Skok, suggests aiming for an LTV-to-CAC ratio of at least 3:1. Below that threshold, you’re likely spending too much to acquire customers relative to what they’re worth, which means your marketing is eroding profit rather than building it.
If your ratio is below 3:1, you have two levers to pull: reduce your CAC or increase your LTV. Reducing CAC means improving marketing efficiency. Increasing LTV means improving retention, increasing average transaction value, or selling additional services to existing customers.
This ratio should immediately change how you think about your marketing budget. A business with a high LTV can afford a higher CAC and should be investing aggressively in acquisition. A business with a low LTV needs to be ruthlessly efficient with every dollar spent.
Step 6: Identify What’s Driving Your CAC Up (And Fix It)
Once you have your CAC calculated and benchmarked against LTV, the natural next question is: why is it this high, and how do I bring it down?
Start by looking at your channel-specific CAC. The channels with the highest CAC are your first diagnostic targets. A high channel CAC usually points to one of a few root causes.
Poor landing page conversion rates: If your ads are generating clicks but those clicks aren’t converting into customers, you’re paying for traffic that goes nowhere. Your ad spend stays the same, but your customer count stays low, which drives CAC up. Improving your landing page, whether that means clearer messaging, a stronger call to action, faster load times, or better social proof, directly reduces CAC because you get more customers from the same spend. This is the mathematical relationship at the heart of conversion rate optimization.
Unqualified leads eating up sales time: If your marketing attracts people who aren’t a good fit for your service, your sales team spends time on calls that don’t convert. That labor cost is in your CAC numerator, but those non-converting leads don’t add to your denominator. Tightening your targeting and adding a lead qualification step before sales calls can dramatically reduce this waste.
Broad ad targeting: Running ads to a wide, untargeted audience typically generates lower-quality leads at a higher cost per conversion. Narrowing your targeting to your actual buyer persona, whether by geography, demographics, intent signals, or keyword specificity, usually reduces cost per lead and improves lead quality simultaneously. If your cost per acquisition is too high, ad targeting is one of the first areas to audit.
Inefficient sales processes: Long follow-up delays, inconsistent outreach, or a lack of a defined sales process means some percentage of qualified leads fall through the cracks. Those lost leads represent marketing spend with no return.
Now, a word of caution: a high CAC isn’t always a problem. If you’re selling high-ticket services with strong LTV, a higher CAC is entirely acceptable. A home remodeling company or a commercial HVAC contractor might have a CAC of $800 or more and still be highly profitable because each customer represents tens of thousands of dollars in revenue. Context always matters.
The compounding effect of even small improvements is worth emphasizing here. If you improve your landing page conversion rate and it results in just five additional customers per quarter without increasing spend, your CAC drops meaningfully. Apply that improvement across multiple channels and the impact compounds over time. For a structured approach to bringing those numbers down, explore our guide on how to lower customer acquisition cost.
Step 7: Build a Monthly CAC Tracking System That Runs on Autopilot
Calculating your CAC once is useful. Tracking it consistently over time is transformational. The goal of this final step is to build a simple system so that monitoring your CAC becomes a routine part of running your business, not a one-off project you do when something feels off.
Start by putting a recurring review on your calendar. Monthly or quarterly, depending on your sales cycle. Block 30 to 60 minutes. Treat it like a financial review, because that’s exactly what it is.
Next, set up a simple tracking dashboard. You don’t need expensive software. A spreadsheet works perfectly. Here are the columns to include:
Period: The month or quarter you’re measuring.
Total Marketing and Sales Spend: The complete cost figure from your expense tracker.
New Customers Acquired: Pulled from your CRM or tracking system.
Blended CAC: Total spend divided by new customers.
CAC by Channel: Separate columns for each major channel you run.
Average LTV: Updated whenever you have new data.
LTV-to-CAC Ratio: Calculated automatically from the two columns above.
Once you have a few periods of data, you’ll start to see trends. Is your CAC trending up? That’s an early warning sign before it becomes a crisis. Is one channel’s CAC creeping higher while another’s stays flat? That’s a reallocation signal. Ongoing customer acquisition cost optimization depends on having this kind of trend data at your fingertips.
Set a threshold for your maximum acceptable CAC based on your LTV-to-CAC ratio target. If your blended CAC exceeds that number in any given period, that’s your trigger to investigate before adding more budget.
Use trends over multiple periods to make decisions, not single-month snapshots. One expensive month might be an anomaly. Three consecutive months of rising CAC is a pattern that demands action.
Finally, know when to bring in outside help. If your CAC is climbing and you can’t identify the cause through your channel-specific breakdown, or if you’re spending significant budget without a clear tracking system in place, a professional audit can quickly surface what’s working, what isn’t, and where the money is going. Sometimes an outside perspective sees what’s invisible from the inside.
Putting It All Together: Your CAC Action Checklist
You now have everything you need to calculate, benchmark, and act on your customer acquisition cost formula. Here’s a quick-reference checklist to run through:
1. Define your measurement window (monthly, quarterly, or annually) and document exactly what counts as a new customer for your business.
2. Gather every sales and marketing expense for your measurement period: ad spend, agency fees, software, content, sales compensation, and your own time.
3. Pull your new customer count from your CRM, booking system, or POS, filtered by conversion date, not lead date.
4. Run the formula: Total Sales and Marketing Costs ÷ New Customers Acquired. Calculate both blended CAC and channel-specific CAC.
5. Calculate your LTV and compare it to your CAC. Aim for a ratio of at least 3:1. Let this ratio guide your budget decisions.
6. Diagnose what’s driving your CAC. Look at conversion rates, lead quality, targeting efficiency, and sales process gaps. Fix the highest-leverage problem first.
7. Build a recurring tracking system with a simple dashboard and calendar reminders. Monitor trends, not one-off snapshots.
Calculating your customer acquisition cost formula is not a one-time exercise. It’s an ongoing discipline. The businesses that track this consistently are the ones that make confident budget decisions, scale what’s working, cut what isn’t, and grow without burning cash in the process.
Run your first calculation this week using the steps above. Even a rough first pass is infinitely more useful than no number at all. Then refine it next month. And the month after that.
Tired of spending money on marketing that doesn’t produce real revenue? At Clicks Geek, we build lead systems that turn traffic into qualified leads and measurable sales growth. If you want to see what this would look like for your business, we’ll walk you through how it works and break down what’s realistic in your market.