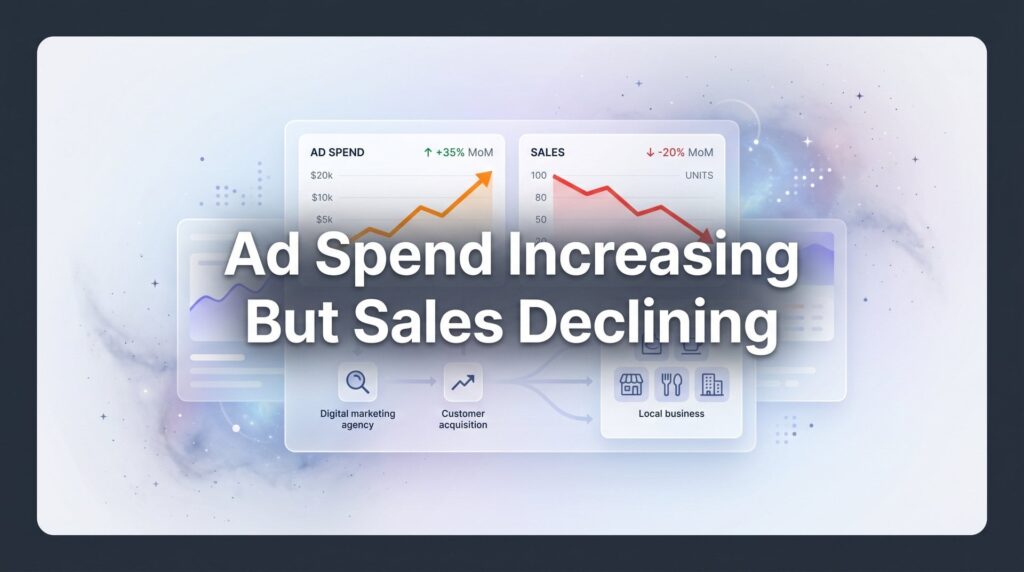
You check your ad dashboard and feel your stomach drop. Again. The numbers tell a story you’ve seen too many times: ad spend climbed another 15% this month, but sales? Down. Not flat—down. You’re paying more to make less, and somewhere between the click and the cash register, your money is vanishing into thin air.
This isn’t just frustrating. It’s a profit killer that signals something fundamental is broken in your marketing funnel. And here’s the hard truth: throwing more budget at the problem won’t fix it. In fact, it often makes things worse.
At Clicks Geek, this scenario is one of the most common issues we see when auditing struggling campaigns. Business owners come to us burning through thousands in ad spend with nothing to show for it, convinced they just need to “scale up” or “try a different platform.” But the real issue? They’re pouring water into a bucket with holes in it.
This guide will help you identify exactly where your money is leaking and what to do about it. We’ll walk through the hidden culprits sabotaging your campaigns, show you how to conduct a proper diagnostic audit, and give you actionable strategies to turn things around. Because here’s what most businesses don’t realize: this problem is solvable—but only when you diagnose the root cause instead of guessing.
The Hidden Culprits Behind Rising Costs and Falling Revenue
Let’s start with the uncomfortable reality: the digital advertising landscape has fundamentally changed in the past few years, and many businesses are still running plays from the old playbook.
First up is market saturation. Your competitors aren’t sleeping. Every month, more businesses pile into the same advertising channels, bidding on the same keywords, targeting the same audiences. This creates a supply-and-demand problem where ad inventory stays relatively fixed while demand skyrockets. The natural result? Cost-per-click rates climb across virtually every industry. What cost you two dollars per click two years ago might now cost you five dollars or more for the exact same keyword.
But rising costs alone don’t explain falling sales. That’s where the second culprit comes in: platform algorithm changes that have fundamentally altered how advertising works. Apple’s privacy updates starting in 2021 didn’t just tweak the system—they broke the targeting and tracking capabilities that advertisers had relied on for years. Facebook Ads, in particular, took a massive hit. The platform that once could target your exact ideal customer with scary precision now operates partially blind, using probabilistic modeling instead of deterministic tracking.
Think of it like this: you used to be able to hand-pick apples from specific trees in an orchard. Now you’re throwing a net over a general area and hoping you catch the right fruit. The targeting got fuzzier, which means more of your budget goes to people who will never buy from you. This is a classic case of high ad spend with low conversions—a problem that requires strategic intervention, not just budget increases.
Then there’s audience fatigue. Your ads might have crushed it six months ago, but your target audience has seen them dozens of times since then. They’ve developed what marketers call “banner blindness”—their brains literally tune out your messaging because it’s become background noise. Engagement rates plummet. Click-through rates drop. And when platforms see declining engagement, they charge you more to reach the same people because their algorithms interpret low engagement as low ad quality.
Here’s where it gets particularly painful: these three factors often compound each other. Higher competition drives up costs, which pressures you to squeeze more from your existing campaigns. So you keep running the same ads to the same audiences, causing fatigue. Meanwhile, platform changes mean those fatigued audiences aren’t even the right people anymore. You end up in a death spiral—paying more to reach the wrong people with ads they’re tired of seeing.
Many businesses respond by increasing budget, thinking scale will solve the problem. But you can’t scale broken campaigns profitably. You’re just accelerating the cash burn.
Your Targeting Might Be Bleeding Money
Here’s a scenario we see constantly: a business owner shows us their Google Ads campaign and proudly explains they’re using “broad match” keywords to “maximize reach.” Then we pull the search terms report and show them they’re paying for clicks from searches like “free marketing tips,” “marketing jobs near me,” or completely unrelated terms that share a word with their actual service.
Broad targeting sounds good in theory. Cast a wide net, catch more fish. But in practice? You’re catching a lot of old boots and shopping carts along with the fish. And you’re paying the same price per boot as you do per fish.
The brutal math works like this: if 70% of your clicks come from people who have zero intent to buy, you’re essentially tripling your actual cost per qualified visitor. That five-dollar click becomes a fifteen-dollar click when you factor in the waste. Suddenly those “cheap” broad match keywords look expensive as hell. Understanding wasted ad spend on wrong customers is the first step toward fixing this problem.
Then there’s the negative keyword problem. Most businesses set up their campaigns, maybe add a few obvious negatives like “free” or “jobs,” and then never touch them again. Meanwhile, their search terms report fills up with hundreds of irrelevant queries draining budget week after week. We’ve seen campaigns where a single overlooked negative keyword was responsible for thousands in wasted spend over just a few months.
Geographic targeting creates another common leak. A local service business sets their ads to target a 50-mile radius because “more reach is better.” But they only actually service a 20-mile radius. Half their ad spend goes to people they literally cannot help, even if they wanted to buy. Or consider the business targeting an entire state when 80% of their customers come from three specific cities. They’re subsidizing clicks from areas that will never generate revenue.
Demographic misalignment works the same way. Your actual customers are business owners aged 35-55, but your targeting includes everyone 25-65 because you don’t want to “miss opportunities.” The result? You’re paying to advertise to college students and retirees who aren’t in your buyer profile. They click, they bounce, you pay.
The insidious part about targeting problems is they’re invisible in aggregate metrics. Your overall click-through rate might look decent. Your cost per click might seem reasonable. But when you dig into the data and segment by search term, location, and demographic, you discover that profitable traffic represents maybe 30% of your total spend. The other 70% is pure waste.
When Landing Pages Sabotage Your Ad Investment
Picture this: you craft the perfect ad. Compelling headline, clear value proposition, strong call-to-action. Someone clicks, genuinely interested in what you’re offering. They land on your page and… confusion. The ad promised one thing, the landing page talks about something slightly different. Or worse, it’s your generic homepage with seventeen different messages competing for attention.
This is message mismatch, and it kills conversions faster than almost anything else. The visitor’s brain does a quick pattern-match: “This isn’t what I clicked on.” Bounce. You just paid for that click. If you’re experiencing website traffic but no conversions, this disconnect is often the primary culprit.
We see this constantly with businesses running multiple ad variations that all point to the same landing page. One ad emphasizes price, another emphasizes quality, a third focuses on speed. They all dump traffic onto a page that tries to be everything to everyone and ends up resonating with no one. The ad set expectations the landing page didn’t meet.
Then there’s the technical stuff that seems minor but absolutely murders your conversion rate. Load time is the silent killer. Every second your page takes to load, you lose a chunk of visitors. A page that takes five seconds to load on mobile? You’ve lost half your traffic before they even see your offer. And you paid for every single one of those clicks.
Mobile experience deserves its own paragraph because it’s where most businesses completely drop the ball. More than half your traffic probably comes from mobile devices, but your landing page was designed on a desktop monitor and barely functions on a phone. Buttons are too small to tap. Forms require zooming and scrolling. Images don’t resize properly. The visitor gives up and leaves. Another wasted click.
Call-to-action problems represent the final conversion killer. Your landing page finally loaded, the message matches the ad, the visitor is interested… and then they don’t know what to do next. Is the CTA “Learn More” or “Get Started” or “Contact Us” or “Schedule a Call”? There are three different buttons offering three different things. Or the CTA is buried below the fold in tiny text. Or it’s so vague that the visitor doesn’t understand what happens when they click it.
Here’s the painful reality: you can have perfect targeting and reasonable ad costs, but if your landing page converts at 1% instead of 5%, you need five times the traffic to get the same results. That means five times the ad spend for the same revenue. A mediocre landing page doesn’t just reduce sales—it makes every other part of your marketing exponentially more expensive.
The worst part? Most businesses never test their landing pages. They set it up once, maybe tweak the headline, and call it done. Meanwhile, simple changes like clarifying the headline, speeding up load time, or making the CTA more prominent could double or triple conversion rates. But they’ll never know because they’re not looking.
The Attribution and Tracking Blind Spots You’re Missing
You’re making decisions based on data that’s lying to you. That’s not hyperbole—it’s the reality for most businesses running digital ads right now.
Conversion tracking breaks more often than you’d think. A developer updates your website and accidentally removes the tracking code. A tag fires twice, inflating your conversion numbers. The tracking pixel is installed on the wrong page. Google Analytics 4 is configured incorrectly and attributes conversions to the wrong source. Or the tracking works fine on desktop but fails on mobile, creating a massive blind spot for half your traffic. If you suspect your data is unreliable, our guide on fixing your marketing conversion tracking walks through exactly how to diagnose and repair these issues.
We’ve audited campaigns where the business owner was convinced Google Ads was performing well based on the platform’s reporting, only to discover that actual sales data told a completely different story. The conversion tracking was counting page views as conversions, or it was picking up test submissions, or it was double-counting the same conversion across multiple platforms. They were optimizing for phantom results.
Multi-touch attribution represents an even bigger blind spot. Here’s how customers actually buy: they see your Facebook ad, don’t click. Three days later, they Google your company name and click an ad. They browse but don’t buy. A week later, they see a retargeting ad, click through, and finally purchase. Which channel gets credit for that sale?
In most default setups, Google Ads claims the conversion because it was the “last click.” Facebook got zero credit even though it created the initial awareness. Your retargeting campaign looks like it’s breaking even at best. Based on this data, you’d be tempted to cut the Facebook and retargeting budget and pour everything into Google. But if you did that, your Google conversions would plummet because you killed the channels that were actually starting the customer journey. Understanding marketing attribution models is essential for making accurate budget decisions.
Platform reporting discrepancies make this worse. Google Analytics says you got 50 conversions this month. Google Ads claims 65. Facebook says 30. Your actual sales records show 45. Which number is real? Each platform uses different attribution windows, different counting methodologies, different definitions of what constitutes a conversion. They’re all technically correct within their own frameworks, and they’re all misleading you.
The iOS privacy changes amplified these tracking problems exponentially. Facebook’s tracking got significantly less accurate. Cross-device tracking became nearly impossible for many businesses. The clean, deterministic data that used to tell you exactly which ad drove which sale? Gone. Now you’re working with modeled data, statistical estimates, and educated guesses.
Here’s what this means in practice: you’re spending money on campaigns that might be working great, but your tracking says they’re failing, so you cut budget. Or you’re dumping money into campaigns that look successful in the dashboard but are actually generating low-quality leads that never close. You’re flying blind and making expensive decisions based on instruments that aren’t showing you reality.
A Step-by-Step Audit to Stop the Bleeding
Enough diagnosis. Let’s talk about how to actually fix this. The first step is conducting a proper audit to identify exactly where your money is disappearing. This isn’t complicated, but it does require looking at data most businesses ignore.
Start with your search terms report if you’re running Google Ads. This is where the bodies are buried. Go into your campaign, click on “Search terms,” and look at every single query that triggered your ads in the past 30 days. Sort by cost. You’re looking for patterns of waste—irrelevant searches, informational queries from people with zero buying intent, searches from geographic areas you don’t serve, or queries that got clicks but never convert.
Create a spreadsheet. Column one: the wasteful search term. Column two: how much you spent on it. Column three: the negative keyword you’ll add to prevent it. Do this for every search term that spent more than twenty dollars without generating a conversion. You’ll probably find thousands of dollars in immediate savings just from this exercise. Many businesses discover that 30-40% of their Google Ads spend goes to completely irrelevant searches. Our comprehensive Google Ads optimization guide provides a detailed framework for this exact process.
Next, audit your landing pages using actual user behavior data. Install a heat mapping tool like Hotjar or Microsoft Clarity on your key landing pages. Let it collect data for at least a week. Then review the recordings and heat maps. Watch where users click, how far they scroll, where they get confused and leave. Look for rage clicks—when someone frantically clicks the same spot repeatedly because something isn’t working. Check your mobile recordings separately because mobile behavior is completely different from desktop.
Pay special attention to your form abandonment rate. If 100 people start filling out your contact form but only 30 submit it, you’ve got a problem. Watch the session recordings to see where they drop off. Is the form too long? Are you asking for information too early? Is there a technical error preventing submission? These insights are gold because fixing form issues can immediately boost conversions without spending another dollar on ads.
Now tackle your conversion tracking. Open Google Analytics 4 and cross-reference the conversion data with your actual sales records or CRM. Do the numbers match? If Analytics shows 50 conversions but you only closed 30 deals, something’s broken. Check your conversion events—are they firing on the right pages? Are there duplicate tags? Test the conversion flow yourself on both desktop and mobile to ensure the tracking fires correctly.
Set up a simple attribution tracking system even if it’s manual. Create a spreadsheet where you log every new lead or sale with the source they came from. Not just “Google Ads” but the specific campaign and keyword if possible. Ask new customers how they found you. Compare this real-world data to what your platforms report. The discrepancies will tell you which data sources you can trust and which ones are misleading you.
Finally, segment your campaign performance by every dimension available. Don’t just look at overall campaign metrics. Break it down by device, location, time of day, day of week, audience segment, and keyword. You’ll almost always find that a small subset of your targeting is generating most of your profitable results while the rest bleeds money. A campaign that looks mediocre overall might have one geographic area or device type that performs incredibly well—but you’ll never see it if you only look at aggregated data.
Turning the Tide: Strategies That Actually Move the Needle
Once you’ve identified where the money is leaking, it’s time to rebuild your campaigns around what actually works. This isn’t about minor tweaks—it’s about fundamental restructuring based on real performance data.
Start by creating campaigns built exclusively around high-intent keywords and proven converters. Take every keyword that has generated a conversion in the past 90 days and put it in its own tightly themed ad group with exact match or phrase match targeting. Yes, this means more ad groups and more granular management. But it also means your budget goes only to searches that have demonstrated actual buying intent. Cut everything else. If a keyword hasn’t converted in 90 days despite getting clicks, it’s not going to suddenly start working—it’s just burning budget. If you’re struggling with ads not converting to sales, this restructuring approach is often the breakthrough moment.
Implement an aggressive negative keyword strategy that you update weekly. This isn’t a set-it-and-forget-it task. Every Monday, pull your search terms report for the past week and add negatives for anything irrelevant. Create negative keyword lists at the account level for common waste terms: “free,” “jobs,” “salary,” “DIY,” “how to,” “cheap,” “discount” (unless you’re actually a discount provider). Build location-based negatives if you’re seeing spend from areas you don’t serve.
Set up audience exclusions to prevent wasted impressions. If someone already converted, exclude them from your prospecting campaigns. If someone visited your site but didn’t convert in the past 90 days, they’re probably not going to—exclude them from cold traffic campaigns and only retarget them with specific offers. If you’re B2B, exclude job seeker audiences. Every click from someone who can’t or won’t buy is money down the drain.
Now apply a conversion rate optimization framework to your landing pages. This doesn’t mean redesigning everything from scratch. Start with the highest-traffic pages and make systematic improvements based on your audit findings. If heat maps showed people weren’t scrolling, move your key message and CTA above the fold. If mobile load time was slow, compress images and remove unnecessary scripts. If the form had high abandonment, cut it down to the minimum required fields.
Test one change at a time so you know what’s actually working. Change the headline and run it for two weeks. Measure the impact. Then test a different CTA button. Then test a simplified form. This systematic approach beats random redesigns because you learn what actually moves the needle for your specific audience. Some businesses see conversion rates double just from clarifying their headline and making the CTA more prominent. Professional sales funnel optimization services can accelerate this process if you need expert guidance.
Finally, shift your budget allocation based on actual performance, not gut feeling. If your audit revealed that mobile traffic converts at 2% while desktop converts at 8%, bid more aggressively for desktop traffic. If one geographic area generates leads at half the cost of another, shift budget there. If certain times of day consistently outperform, use ad scheduling to focus spend during those windows. Most businesses spread budget evenly across all targeting options. Winners concentrate budget on what’s proven to work and ruthlessly cut what doesn’t.
Putting It All Together
Ad spend increasing while sales decline isn’t a mystery—it’s a solvable problem with identifiable causes and proven solutions. But here’s the thing: you can’t fix it by doing more of what’s already failing. Throwing more budget at broken campaigns just accelerates the cash burn.
The path forward requires honest diagnosis. Pull your search terms reports and face the reality of where your money is actually going. Audit your landing pages with real user behavior data instead of assumptions. Fix your conversion tracking so you’re making decisions based on truth instead of phantom metrics. Then rebuild your campaigns around the targeting, messaging, and pages that actually convert.
This isn’t a one-time fix. Markets change. Competition evolves. Platforms update their algorithms. What works today might need adjustment in three months. The businesses that win are the ones that treat this as an ongoing optimization process, not a set-it-and-forget-it campaign launch.
Most importantly, stop accepting mediocre results just because “that’s how digital advertising works now.” Yes, costs have gone up. Yes, tracking got harder. But profitable campaigns are absolutely still possible when you focus on high-intent targeting, conversion-optimized landing pages, and accurate attribution. The businesses struggling are the ones still running 2019 playbooks in a 2026 market.
Tired of spending money on marketing that doesn’t produce real revenue? We build lead systems that turn traffic into qualified leads and measurable sales growth. If you want to see what this would look like for your business, we’ll walk you through how it works and break down what’s realistic in your market. Because at Clicks Geek, we don’t just drive traffic—we drive revenue. And we can show you exactly where your current campaigns are bleeding money and how to fix it.