You’re spending $3,000 a month on Google Ads. Your Facebook campaigns are running. You’ve got a new website. But when someone asks if your marketing is actually working, you pause. You know calls are coming in—some of them, anyway. Sales happen. But which ads brought those customers? Which keywords are worth the money? Which campaigns are bleeding your budget dry?
You’re not alone. Most local business owners are flying blind, making marketing decisions based on gut feeling rather than hard data. The problem isn’t that the information doesn’t exist—it’s that nobody’s shown you how to turn those numbers into decisions that actually grow your business.
This guide changes that. We’re going to walk through exactly how marketing analytics and reporting transforms your marketing from an expensive guessing game into a predictable growth engine. No technical jargon. No overwhelming spreadsheets. Just the practical framework you need to know what’s working, what’s not, and where to invest your next dollar for maximum return.
Why Your Marketing Feels Like Throwing Darts Blindfolded
Let’s start with a critical distinction that changes everything: marketing data isn’t the same as marketing analytics.
Data is the raw numbers. You spent $500 on ads. You got 1,200 clicks. Your website had 3,400 visitors last month. These numbers exist in your Google Ads account, your Facebook dashboard, your website analytics. But by themselves? They tell you almost nothing about whether your marketing is actually working.
Marketing analytics is what happens when you connect those dots. It’s the interpretation layer that answers the questions keeping you up at night: Which campaign brought in the customer who spent $5,000? What’s the real cost of acquiring a new client? Which marketing channel delivers leads that actually convert into sales?
Here’s what analytics-blind marketing looks like in practice. Your ad spend varies month to month based on cash flow, not performance. You can’t explain why some months are great and others are terrible. When someone asks about ROI, you talk about website traffic or social media engagement instead of actual revenue. You’ve tried three different marketing strategies in the past year because nothing seems to “work,” but you can’t pinpoint why.
Sound familiar?
The symptoms are consistent across industries. Budget waste happens because you’re funding campaigns that feel productive but don’t generate qualified leads. Inconsistent results plague your business because you’re not systematically reinforcing what works and eliminating what doesn’t. And perhaps most frustrating—you can’t scale. When you do have a good month, you have no idea which lever to pull to make it happen again.
Proper marketing analytics and reporting creates something powerful: a feedback loop. You run campaigns. You measure what happens. You identify patterns. You adjust based on evidence. You improve. Then you repeat the cycle, and each iteration makes your marketing more effective than the last. Understanding why marketing isn’t working for your business often starts with recognizing this missing feedback loop.
This compounds over time. A business that improves their marketing effectiveness by 10% each quarter isn’t just marginally better than competitors—they’re exponentially more profitable. While other businesses keep throwing money at the same ineffective tactics, you’re systematically optimizing every dollar you spend.
The Metrics That Actually Move the Needle for Local Businesses
Let’s cut through the noise. Most marketing reports are filled with metrics that sound impressive but don’t tell you anything useful about business growth. Impressions. Reach. Engagement rate. These might matter to brand marketers at Fortune 500 companies, but for local businesses? They’re distractions.
Your most important number is Customer Acquisition Cost. CAC tells you exactly how much you’re spending to bring in each new customer. Calculate it by dividing your total marketing spend by the number of new customers acquired in that period.
If you spent $4,000 on marketing last month and acquired 10 new customers, your CAC is $400. Now you have a baseline. Is $400 reasonable for your business? That depends entirely on what a customer is worth to you. If your average customer spends $200 once and never returns, you’ve got a problem. If your average customer is worth $3,000 over their lifetime, you’ve got a profitable marketing system.
This brings us to Return on Ad Spend versus overall marketing ROI. ROAS is simpler—it’s the revenue generated divided by ad spend. If you spent $1,000 on Google Ads and those ads directly generated $5,000 in sales, that’s a 5:1 ROAS. Sounds great, right?
But overall ROI accounts for everything: ad spend, agency fees, content creation costs, your time. It’s the complete picture of what you’re investing versus what you’re getting back. Many businesses celebrate a strong ROAS while their actual ROI is negative once they factor in all costs. Learning how to track marketing ROI properly separates profitable businesses from those bleeding money without realizing it.
For local businesses, lead quality metrics matter more than lead volume. You can generate 100 leads at $10 each or 20 leads at $50 each—which is better? The answer depends entirely on conversion rates by source.
Track cost per qualified lead, not just cost per lead. A qualified lead meets your criteria: right location, right budget, right need. If your Google Ads generate leads at $75 each and 40% become customers, while your Facebook ads generate leads at $30 each but only 5% convert, Google is actually your better channel despite the higher upfront cost.
Customer lifetime value indicators help you make smarter budget decisions. If you know the average customer stays with you for three years and spends $10,000 total, you can afford to spend more on acquisition than if they’re one-time purchasers. Track repeat purchase rates, average order values over time, and retention metrics by acquisition source.
Some marketing channels bring customers who stick around. Others bring tire-kickers who buy once and disappear. This intelligence changes how you allocate budget. You might discover that customers acquired through local search spend 40% more over their lifetime than customers from social media ads—even if the initial acquisition cost is higher.
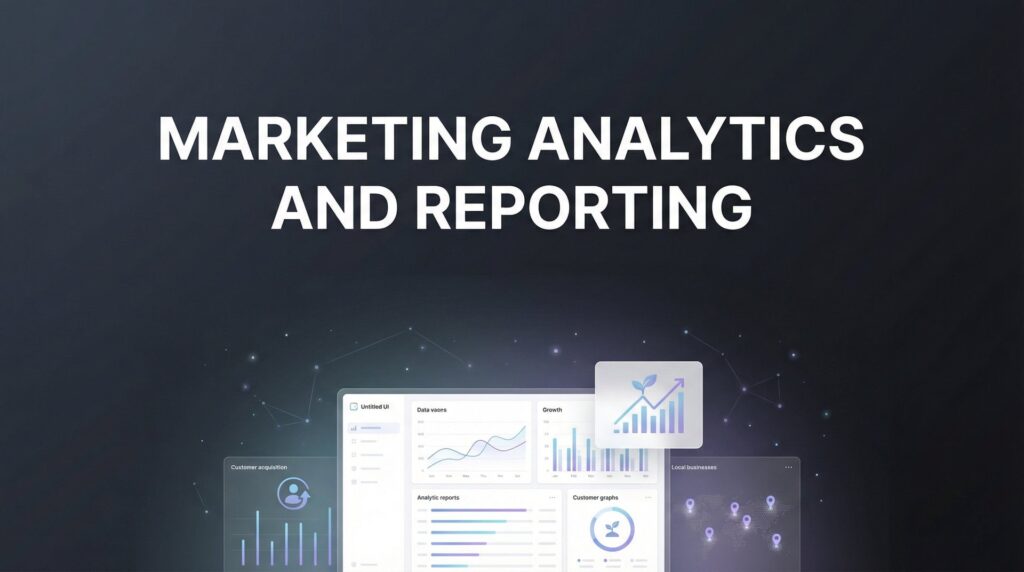
Building Your Analytics Foundation: Tools and Setup
You can’t improve what you don’t measure. But you also can’t drown in data and expect clarity. The goal is building a foundation that captures meaningful information without overwhelming your team.
Start with Google Analytics 4. It’s free, comprehensive, and essential for understanding website behavior. But here’s what most business owners miss: out-of-the-box GA4 tells you almost nothing useful. You need to set up conversion tracking that actually matters to your business.
Define your conversions based on actions that indicate real interest. Form submissions. Phone calls. Quote requests. Appointment bookings. Chat conversations. These are your money events—the moments when a website visitor becomes a potential customer. Configure GA4 to track each of these as separate conversions so you can see which traffic sources drive which types of leads. If you’re not tracking marketing conversions properly, you’re essentially flying blind with your ad spend.
The technical setup matters. Use Google Tag Manager to implement tracking codes. Set up enhanced measurement for scroll depth and video engagement if those metrics indicate interest for your business. Configure event parameters that capture lead quality indicators—did they fill out the detailed quote form or just the newsletter signup?
Call tracking bridges the gap between online marketing and offline conversions. Many local business customers pick up the phone rather than filling out forms. Without call tracking, you’re blind to which campaigns drive phone leads.
Modern call tracking for marketing campaigns assigns unique phone numbers to different marketing sources. Your Google Ads show one number. Your Facebook campaigns show another. Your organic search results show a third. When calls come in, you know exactly which campaign generated that lead. Advanced systems record calls and integrate with your CRM, creating a complete record of the customer journey from ad click to phone conversation to closed sale.
Form attribution connects your website forms to traffic sources. When someone fills out a contact form, you need to know: Did they come from a paid ad? Which ad? What keyword did they search? Did they visit multiple times before converting? Quality form tracking captures UTM parameters, referral sources, and user behavior leading up to conversion.
The power comes from unification. Your Google Analytics shows website behavior. Your call tracking shows phone leads. Your CRM shows which leads became customers. Your accounting system shows revenue. Most businesses have this information scattered across five platforms, making it nearly impossible to see the complete picture.
Create a unified dashboard that brings everything together. Tools like Google Data Studio connect to multiple data sources and display them in one view. Build a dashboard that shows the metrics that matter: leads by source, cost per lead by channel, conversion rates, revenue attribution, and CAC by campaign. Update it automatically so you’re always looking at current data, not last month’s snapshot.
From Raw Data to Strategic Decisions: The Reporting Framework
Data without action is just noise. The reporting framework transforms numbers into decisions that improve your marketing every single week.
Establish a weekly reporting rhythm for tactical optimization. Every Monday morning, review the previous week’s performance. Which campaigns exceeded their target cost per lead? Which fell short? Are there obvious wins to scale or clear losers to pause? Weekly reviews catch problems fast—you’re not waiting a month to discover a campaign has been hemorrhaging money.
Your weekly report should be simple. Total spend by channel. Leads generated by source. Cost per lead compared to target. Any significant changes from the previous week. This isn’t about comprehensive analysis—it’s about spotting trends and making quick adjustments. If your Google Ads cost per lead jumped 60% this week, you need to investigate immediately, not wait for the monthly review.
Monthly reporting digs deeper into patterns and performance. This is where you analyze what’s working and why. Which keywords consistently deliver qualified leads? Which ad copy resonates? Which landing pages convert? Monthly reports should track performance against goals, identify trends over time, and surface opportunities for optimization.
Look at month-over-month changes in key metrics. Is your overall CAC trending up or down? Are certain channels becoming more or less efficient? Is lead quality improving? Monthly reviews reveal patterns that weekly snapshots miss—seasonal fluctuations, gradual declines that need attention, or steady improvements that validate your strategy.
Quarterly reporting connects marketing performance to business outcomes. This is the strategic layer. How many new customers did marketing bring in this quarter? What was the total acquisition cost? How does this quarter compare to last quarter and the same quarter last year? What’s the revenue impact of your marketing investment?
Quarterly reviews are when you make big decisions. Should you increase budget in Q4 based on strong Q3 performance? Is it time to test a new channel? Should you shift budget from one campaign to another based on three months of consistent data? These aren’t snap judgments—they’re strategic moves backed by evidence. Understanding marketing attribution models helps you make these quarterly decisions with confidence.
Reading reports like a business owner means focusing on actionable patterns, not getting lost in minutiae. You don’t need to understand every technical metric. You need to answer these questions: Are we acquiring customers at a profitable cost? Which marketing channels drive the best results? Where should we invest more? What should we cut?
Watch for red flags that signal immediate action. Cost per lead suddenly doubles—investigate what changed. Conversion rates drop significantly—check if your landing page broke or if lead quality shifted. A previously strong campaign stops performing—look for increased competition or audience saturation. These signals tell you when to intervene before small problems become expensive disasters.
The reporting framework isn’t about generating pretty charts. It’s about creating a system where data flows into decisions, decisions drive actions, and actions improve results. Every week, every month, every quarter—you’re getting smarter about what works for your specific business in your specific market.
Turning Insights Into More Customers
Analytics reveals opportunities. Action captures them. This is where marketing analytics and reporting translates into actual business growth.
Start by identifying your highest-converting channels and doubling down. Your data will reveal that not all marketing sources are created equal. You might discover that Google Local Services Ads deliver leads at $45 each with a 35% close rate, while Facebook ads generate leads at $25 each but only 8% become customers. The cheaper lead source is actually the more expensive customer source.
Once you identify what’s working, scale it aggressively. If a specific keyword consistently delivers qualified leads at a profitable CAC, increase budget allocation until you hit diminishing returns. If a particular audience segment converts at twice the rate of others, build more campaigns targeting similar profiles. The businesses that win aren’t necessarily the ones who discover magic tactics—they’re the ones who recognize what’s working and systematically scale it.
Use A/B testing informed by data to continuously improve performance. Your analytics show which landing pages convert best—now test variations to make them even better. Your reports reveal which ad headlines generate the most clicks—create new versions that build on those themes. Your data indicates which offers drive action—experiment with different positioning of the same core value proposition. Implementing conversion focused marketing services can accelerate this optimization process significantly.
A/B testing without analytics is guesswork. A/B testing with analytics is systematic improvement. Test one variable at a time so you know what caused the change. Run tests long enough to reach statistical significance—don’t make decisions based on 20 conversions. Document what you learn and apply those insights across campaigns.
Budget reallocation based on performance data is where analytics directly impacts profitability. Most businesses set marketing budgets at the beginning of the year and leave them unchanged regardless of performance. Data-driven businesses reallocate constantly based on what the numbers reveal.
If Channel A delivers a 6:1 ROI while Channel B delivers 2:1, shift budget from B to A until you maximize Channel A’s potential. If Q4 historically outperforms Q2 by 40%, frontload more budget into those high-performing months. If certain geographic areas convert at dramatically higher rates, concentrate spending where it matters most.
This doesn’t mean abandoning channels that underperform—it means optimizing allocation based on evidence. Maybe Channel B deserves 15% of budget instead of 40%. Maybe it needs better creative or targeting rather than more money. Your analytics tell you where the opportunity lives.
The compound effect of data-driven optimization is remarkable. Improve your cost per lead by 15% through better targeting. Increase conversion rates by 10% through landing page optimization. Boost average order value by 12% through better offer positioning. Individually, these are nice wins. Together, they transform your marketing economics entirely.
A business that makes these incremental improvements every quarter doesn’t just grow—they dominate their market while competitors wonder why their marketing “stopped working.” The difference is systematic optimization based on real data rather than opinions, assumptions, or whatever the latest marketing guru is selling.
Putting Your Analytics Into Action
Theory is useless without implementation. Here’s your 30-day roadmap for building a marketing analytics system that drives real business growth.
Week 1: Audit your current tracking. Log into every platform you use—Google Ads, Facebook Ads, your website analytics, your CRM. Document what’s being tracked and what’s missing. Identify gaps where leads or conversions aren’t being captured. List all the questions you can’t currently answer about your marketing performance.
Week 2: Implement conversion tracking across all platforms. Set up Google Analytics 4 goals for every meaningful action on your website. Configure call tracking if phone leads matter to your business. Add UTM parameters to all campaign links so you can track traffic sources accurately. Install tracking pixels for retargeting and conversion optimization.
Week 3: Build your unified dashboard. Connect your data sources into a single view using Google Data Studio or similar tools. Focus on the metrics that matter: leads by source, cost per lead, conversion rates, and customer acquisition cost. Make sure it updates automatically—manual data entry defeats the purpose. Building your marketing technology stack properly ensures all these tools communicate seamlessly.
Week 4: Establish your reporting rhythm. Schedule your weekly review time. Set up monthly reporting templates. Define your quarterly review process. Most importantly, decide who’s responsible for analyzing the data and making recommendations. Analytics without accountability becomes another ignored report.
This 30-day implementation creates the foundation. From there, you’re continuously refining. Add new tracking as you launch new campaigns. Improve your dashboard as you identify better ways to visualize performance. Deepen your analysis as you learn which patterns predict success.
When should you DIY versus partnering with experts? If you’re spending less than $2,000 monthly on marketing, you can probably handle basic analytics yourself using free tools. Your needs are straightforward: track leads, measure cost per lead, understand which sources work. Focus on the fundamentals and don’t overcomplicate it.
As your marketing spend and complexity increase, professional analytics becomes invaluable. When you’re running campaigns across multiple platforms, managing significant budgets, or need sophisticated attribution modeling, experts save you more money than they cost. They’ve built these systems dozens of times. They know the pitfalls. They can implement in weeks what might take you months to figure out. Knowing how to hire a digital marketing agency that prioritizes analytics can make all the difference in your results.
The real question isn’t whether you can learn analytics—it’s whether that’s the best use of your time as a business owner. Your expertise is running your business, serving customers, and driving growth. Analytics is a specialized skill that takes years to master. Partnering with professionals who live in this world daily often delivers better results faster than trying to become an analytics expert yourself.
The transformation happens when marketing shifts from an expense you hope pays off to an investment with predictable returns. That’s what proper analytics and reporting delivers. You stop wondering if marketing works and start knowing exactly which dollars generate which customers at what cost.
The Bottom Line
Marketing analytics and reporting isn’t about becoming a data scientist. It’s not about drowning in spreadsheets or obsessing over vanity metrics that don’t impact revenue. It’s about knowing—with certainty—which marketing dollars bring customers through your door and which are being wasted.
The businesses winning in their markets right now aren’t necessarily spending more on marketing. They’re spending smarter. They know their customer acquisition cost. They understand which channels deliver qualified leads. They make budget decisions based on performance data rather than gut feeling. They optimize continuously instead of hoping this month will be better than last month.
This creates a massive competitive advantage. While your competitors are still guessing, you’re making decisions backed by evidence. While they’re spreading budget equally across channels “just to be safe,” you’re concentrating resources where they generate the highest return. While they’re frustrated that marketing doesn’t work, you’re systematically scaling what does.
The framework we’ve covered—tracking the right metrics, building proper infrastructure, establishing reporting rhythms, and turning insights into action—transforms marketing from a cost center into a growth engine. It’s the difference between spending money and making investments. Between hoping for results and engineering them.
Start with the 30-day implementation plan. Get your tracking foundation in place. Build your dashboard. Establish your reporting rhythm. Then commit to the process. Review your data weekly. Optimize based on what you learn. Scale what works. Cut what doesn’t. Make decisions based on evidence rather than assumptions.
The compound effect of this approach is extraordinary. Small improvements in cost per lead, conversion rates, and customer value multiply into significant business growth. Six months from now, your marketing will be dramatically more effective than it is today—not because you discovered some secret tactic, but because you systematically optimized based on real performance data.
Tired of spending money on marketing that doesn’t produce real revenue? We build lead systems that turn traffic into qualified leads and measurable sales growth. If you want to see what this would look like for your business, we’ll walk you through how it works and break down what’s realistic in your market.
The question isn’t whether analytics-driven marketing works—it does, consistently and predictably. The question is whether you’re ready to stop guessing and start growing with confidence. Your competitors are making decisions in the dark. You don’t have to.
Want More Leads for Your Business?
Most agencies chase clicks, impressions, and “traffic.” Clicks Geek builds lead systems. We uncover where prospects are dropping off, where your budget is being wasted, and which channels will actually produce ROI for your business, then we build and manage the strategy for you.