You’re spending money on PPC ads every month. The clicks are coming in. The dashboard shows numbers going up and down. But here’s the question keeping you up at night: Is this actually working?
Most local business owners stare at their Google Ads account and see a wall of data that might as well be written in another language. Meanwhile, that monthly ad spend keeps draining from your account whether the campaigns are printing money or burning it.
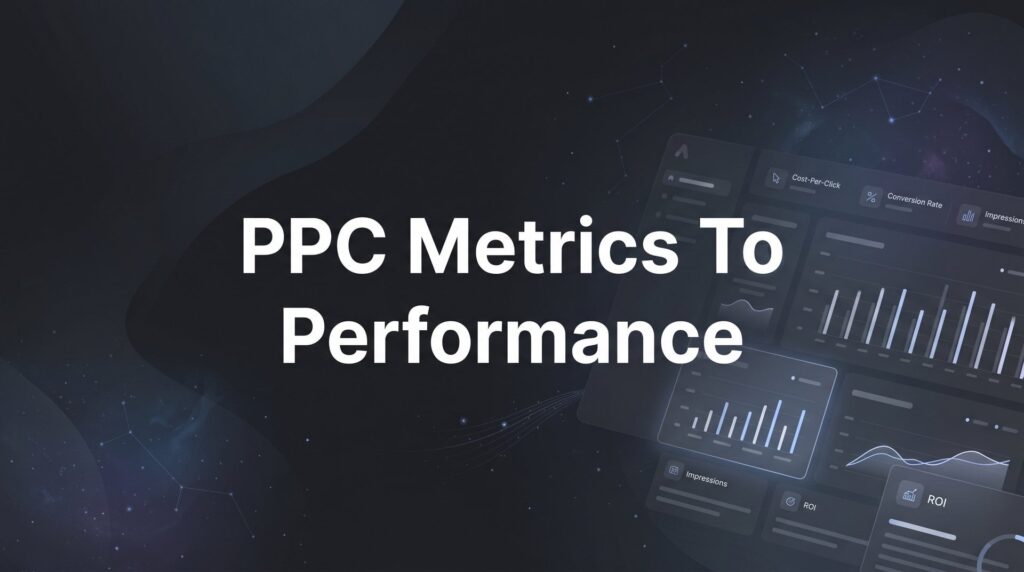
The difference between profitable PPC campaigns and expensive mistakes comes down to tracking the right metrics. Not every number in your dashboard matters. Some metrics look impressive but mean nothing for your bottom line. Others seem boring but directly predict whether you’re making money or losing it.
As a Google Premier Partner agency, we’ve managed millions in ad spend for local businesses. We’ve seen what separates campaigns that generate real revenue from those that just generate reports. The truth? You don’t need to become a data scientist. You need to focus on eight specific metrics that actually move the needle.
This guide breaks down exactly which numbers deserve your attention and what they mean for your business. By the end, you’ll know how to spot a winning campaign, identify problems before they drain your budget, and make decisions based on profitability instead of guesswork.
1. Click-Through Rate (CTR): Your First Signal of Ad Relevance
The Challenge It Solves
Your ads are showing up, but nobody’s clicking. You’re paying for impressions that go nowhere, and you have no idea if your message is resonating with potential customers. Without understanding CTR, you’re essentially throwing darts in the dark, hoping something connects with your audience.
CTR tells you whether people find your ad compelling enough to take action. Low CTR means your message isn’t landing. High CTR means you’ve found something that resonates.
The Strategy Explained
Click-through rate measures the percentage of people who see your ad and actually click on it. It’s calculated by dividing clicks by impressions, then multiplying by 100. If 1,000 people see your ad and 50 click, you’ve got a 5% CTR.
This metric reveals message-market fit. When your ad speaks directly to what people are searching for, they click. When it misses the mark, they scroll past. CTR acts as your early warning system for ad relevance problems.
For local businesses, CTR varies significantly by industry and keyword intent. Someone searching “emergency plumber near me” has different click behavior than someone searching “kitchen remodeling ideas.” Understanding your baseline helps you spot underperformers.
Implementation Steps
1. Check your campaign-level CTR in Google Ads by navigating to the Campaigns tab and adding the CTR column to your view.
2. Identify ads with CTR significantly below your account average—these need immediate attention for ad copy improvements.
3. Test new ad variations for underperforming keywords, focusing on headlines that directly address the search intent and include your target keyword.
4. Monitor CTR changes weekly, especially after making ad copy adjustments, to see which messages resonate with your audience.
Pro Tips
Don’t chase unrealistic CTR goals. A 2% CTR on broad terms might be excellent, while 10% on branded searches might be average. Context matters more than absolute numbers. Focus on improving your own baseline, and watch how CTR improvements often lead to better Quality Scores and lower costs.
2. Cost Per Click (CPC): Understanding What Each Visitor Costs
The Challenge It Solves
You’re getting clicks, but the costs are all over the place. Some keywords drain your budget in hours while others barely spend anything. Without understanding CPC patterns, you can’t predict your budget needs or identify which keywords are pricing you out of profitability.
CPC gives you the fundamental building block for all other cost calculations. Every metric downstream—from cost per lead to return on ad spend—starts with how much you’re paying per click.
The Strategy Explained
Cost per click is exactly what it sounds like: the amount you pay each time someone clicks your ad. Google determines your actual CPC through an auction system where your bid, Quality Score, and competition all play a role.
Here’s what many business owners miss: you rarely pay your maximum bid. Google charges you just enough to beat the advertiser below you. This means improving your Quality Score can dramatically reduce your actual CPC even without changing your bid.
CPC varies wildly by industry and keyword intent. High-value services like legal or medical typically see higher CPCs because the customer lifetime value justifies the cost. Local service businesses might pay anywhere from a few dollars to over fifty dollars per click depending on their market.
Implementation Steps
1. Review your keyword-level CPC data by going to the Keywords tab and sorting by average CPC to identify your most expensive terms.
2. Compare your CPC against your conversion rate to calculate which keywords are worth their cost—high CPC only matters if conversions justify it.
3. Identify keywords where your CPC has increased significantly over the past 30 days, as these signal rising competition or Quality Score issues.
4. Set up automated rules to pause keywords that exceed a specific CPC threshold without generating conversions within a reasonable timeframe.
Pro Tips
Don’t automatically pause high-CPC keywords. A fifty-dollar click that converts at 20% and generates a thousand-dollar customer is a bargain. A two-dollar click that never converts is expensive. Always evaluate CPC in the context of conversion rate and customer value, not in isolation. Understanding how to track your AdWords ROI helps you make these evaluations with confidence.
3. Conversion Rate: The Bridge Between Traffic and Revenue
The Challenge It Solves
Traffic is pouring in, but your phone isn’t ringing and your contact form sits empty. You’re spending money to drive visitors who disappear without taking action. Without tracking conversion rate, you can’t tell if you have a traffic quality problem or a website problem.
Conversion rate reveals the effectiveness of your entire funnel—from ad message to landing page experience. It’s the metric that separates clicks that matter from clicks that waste money.
The Strategy Explained
Conversion rate measures the percentage of clicks that turn into valuable actions: phone calls, form submissions, purchases, or appointment bookings. Calculate it by dividing conversions by clicks, then multiplying by 100.
For local businesses, conversion tracking often requires capturing offline actions. Someone might click your ad, call from their mobile phone, and never fill out a form. If you’re not tracking those calls as conversions, you’re missing half the picture. Implementing call tracking for marketing campaigns ensures you capture every lead source accurately.
Conversion rate tells you if your traffic is qualified and if your landing experience is working. Low conversion rates with high CTR often mean message mismatch—your ad promises something your landing page doesn’t deliver. High conversion rates validate that you’re attracting the right people with the right message.
Implementation Steps
1. Set up conversion tracking in Google Ads for every valuable action: form submissions, phone calls, chat initiations, and any other lead-generating activity on your site.
2. Implement call tracking with a service that integrates with Google Ads so phone conversions appear in your dashboard alongside form submissions.
3. Review conversion rate by campaign and ad group to identify which targeting approaches generate the most qualified traffic.
4. Analyze the conversion rate difference between mobile and desktop traffic, as this often reveals device-specific user experience issues.
Pro Tips
Benchmark your conversion rate against your own historical data, not industry averages. A plumber’s conversion rate looks different from a lawyer’s, and emergency services convert differently than planned purchases. Focus on improving your baseline month over month rather than chasing someone else’s numbers.
4. Cost Per Acquisition (CPA): The True Cost of Each Customer
The Challenge It Solves
You know what you’re paying per click, but you have no idea what you’re actually paying to acquire a customer. Without CPA visibility, you can’t determine if your campaigns are profitable or if you’re losing money on every lead that comes through the door.
CPA connects your ad spend directly to business outcomes. It’s the metric that tells you whether your marketing investment makes financial sense.
The Strategy Explained
Cost per acquisition calculates how much you spend to acquire one customer or qualified lead. Divide your total ad spend by the number of conversions to get your CPA. If you spent five hundred dollars and got ten leads, your CPA is fifty dollars.
This metric only works if you’ve properly defined what counts as a conversion. For local businesses, this typically means phone calls from qualified prospects, form submissions from people ready to buy, or direct bookings. Not all form fills are created equal—someone asking about your hours isn’t the same as someone requesting a quote.
CPA becomes powerful when you compare it against your customer lifetime value. If acquiring a customer costs you two hundred dollars but they’re worth two thousand dollars over their lifetime, you’ve got room to scale. If acquisition costs exceed customer value, you’re in trouble.
Implementation Steps
1. Calculate your average customer lifetime value by reviewing your sales data from the past year and determining what each customer is worth to your business.
2. Set a target CPA based on your customer value—typically, you want acquisition costs below 20-30% of customer lifetime value for healthy margins.
3. Review CPA by campaign to identify which targeting approaches deliver customers at acceptable costs versus which drain budget inefficiently.
4. Implement automated bidding strategies in Google Ads using your target CPA, allowing the system to optimize toward your cost goals.
Pro Tips
Remember that CPA measures cost per conversion, not cost per customer. If only 50% of your leads close, your actual customer acquisition cost is double your CPA. Build this conversion-to-customer ratio into your profitability calculations to avoid nasty surprises when you scale spending. Learning how to track marketing ROI helps you connect these numbers to real revenue.
5. Return on Ad Spend (ROAS): The Ultimate Profitability Metric
The Challenge It Solves
You’re tracking leads and costs, but you still can’t answer the most important question: Are you making money? Without ROAS visibility, you’re managing campaigns based on activity metrics rather than actual profitability. You might be generating tons of leads while losing money on every single one.
ROAS cuts through all the noise and tells you exactly how much revenue you’re generating for every dollar you spend on ads.
The Strategy Explained
Return on ad spend measures revenue generated divided by ad spend, typically expressed as a ratio. If you spend one thousand dollars on ads and generate five thousand dollars in revenue, your ROAS is 5:1 or 500%.
For local businesses, calculating ROAS requires tracking revenue back to specific campaigns. This is straightforward for e-commerce but trickier for service businesses where the sale happens offline. You need systems that connect ad clicks to closed deals, whether through CRM integration or manual tracking.
ROAS tells you which campaigns are printing money and which are burning it. A campaign with a 2:1 ROAS might be profitable or unprofitable depending on your margins. If your cost of goods sold is 60%, a 2:1 ROAS means you’re breaking even. Understanding your break-even ROAS is critical for making smart scaling decisions.
Implementation Steps
1. Implement revenue tracking by connecting your CRM or sales system to Google Ads, or manually uploading conversion values for closed deals.
2. Calculate your break-even ROAS by dividing your average order value by your profit margin—this tells you the minimum ROAS needed to stay profitable.
3. Review ROAS by campaign and keyword to identify your most profitable traffic sources and shift budget toward them.
4. Set up custom columns in Google Ads to display ROAS alongside other metrics so profitability is always visible when you’re making optimization decisions.
Pro Tips
Don’t confuse ROAS with ROI. ROAS only accounts for ad spend, not your total costs including labor, overhead, and cost of goods sold. A 3:1 ROAS might represent a 50% ROI or a loss, depending on your business model. Always factor in your complete cost structure when evaluating profitability. Understanding what performance marketing is helps you build campaigns focused on measurable returns.
6. Quality Score: Google’s Rating That Controls Your Costs
The Challenge It Solves
You’re paying more per click than your competitors for the same keywords, and you can’t figure out why. Your bids are competitive, but your ads aren’t showing up in top positions. Quality Score is Google’s behind-the-scenes rating system that’s either saving you money or costing you a fortune.
Understanding Quality Score helps you reduce costs without increasing bids, improve ad positions without spending more, and identify exactly what Google thinks is wrong with your campaigns.
The Strategy Explained
Quality Score is Google’s 1-10 rating of your ad quality based on three components: expected click-through rate, ad relevance, and landing page experience. Higher scores mean lower costs and better ad positions. Lower scores mean you pay a premium for every click.
Here’s what makes Quality Score powerful: it directly impacts your ad rank and CPC. An advertiser with a Quality Score of 8 might pay half as much per click as someone with a Quality Score of 4, even with identical bids. Over time, these savings compound dramatically.
Quality Score forces you to think like Google. The search engine wants to show ads that users find helpful and relevant. When your ads, keywords, and landing pages align tightly with search intent, Google rewards you with lower costs and better visibility.
Implementation Steps
1. Check Quality Score at the keyword level by adding the Quality Score column to your keywords view in Google Ads.
2. Identify keywords with Quality Scores below 5, as these are actively hurting your performance and driving up costs across your account.
3. Review the three Quality Score components for low-scoring keywords to see whether you have a CTR problem, a relevance problem, or a landing page problem.
4. Create tightly themed ad groups where keywords, ad copy, and landing pages all focus on the same specific topic rather than mixing multiple themes together.
Pro Tips
Quality Score is historical, meaning it reflects past performance. When you fix issues, don’t expect immediate score changes. Google needs to collect new data on your improved ads and landing pages. Give changes at least two weeks to impact scores, and focus on the component ratings rather than the overall score for faster feedback. If you’re struggling with PPC campaign performance issues, Quality Score is often the culprit.
7. Impression Share: Uncovering Your Missed Opportunities
The Challenge It Solves
Your campaigns are running, but you have no idea how many potential customers are seeing your competitors’ ads instead of yours. You might be missing 80% of available searches because of budget constraints or low ad rank, and you’d never know without checking impression share.
Impression share reveals the gap between your current visibility and your potential visibility, showing exactly where you’re leaving money on the table.
The Strategy Explained
Impression share measures what percentage of available impressions your ads actually received. If your ads showed 500 times but were eligible to show 1,000 times, you have a 50% impression share. The other 50% went to competitors or went unfilled.
Google breaks down why you’re missing impressions: budget limitations or ad rank issues. Budget lost impression share means you ran out of money before the day ended. Rank lost impression share means your bids or Quality Scores weren’t competitive enough to win auctions.
For local businesses with limited budgets, impression share helps you make strategic choices. You can’t afford to show up for every search, so you need to focus on the most valuable opportunities. Impression share data reveals where you’re already strong and where you’re getting crowded out.
Implementation Steps
1. Add impression share columns to your campaigns view, specifically Search Impression Share, Search Lost IS (budget), and Search Lost IS (rank).
2. Identify campaigns with high budget lost impression share—these campaigns are running out of money and missing potential customers.
3. Review campaigns with high rank lost impression share to determine if you need to increase bids or improve Quality Scores to compete effectively.
4. Calculate the potential impact of improving impression share by multiplying your current clicks by the percentage of lost impression share to estimate missed opportunities.
Pro Tips
Don’t chase 100% impression share. It’s often inefficient and expensive to show up for every single search, especially at odd hours or for marginally relevant queries. Focus on achieving high impression share during your best-performing hours and for your highest-value keywords rather than spreading budget thin across everything. Tracking the right marketing KPIs helps you prioritize where to compete.
8. Search Terms Report: What People Actually Search For
The Challenge It Solves
You’re bidding on keywords you think matter, but you have no idea what search queries are actually triggering your ads. Your “plumbing services” keyword might be showing ads for “plumbing school” or “plumbing supplies,” wasting money on completely irrelevant clicks. Without the search terms report, you’re blind to what’s really happening.
This report reveals the actual words people type into Google before seeing your ads, exposing both wasted spend and golden opportunities you’re missing.
The Strategy Explained
The search terms report shows every query that triggered your ads, along with performance data for each one. It’s the gap between the keywords you bid on and the searches Google matches them to. Broad match keywords especially can trigger ads for wildly different searches than you intended.
This report serves two critical functions: identifying waste and discovering opportunities. On the waste side, you’ll find irrelevant searches draining your budget that need to be added as negative keywords. On the opportunity side, you’ll discover high-performing search terms that deserve their own dedicated keywords and ad groups.
For local businesses, the search terms report often reveals location-specific queries, competitor names, and service variations you hadn’t considered. Someone searching “emergency water heater repair Sunday” is more valuable than someone searching “water heater information,” but both might trigger the same keyword.
Implementation Steps
1. Access the search terms report by clicking on Keywords in your Google Ads account, then selecting Search Terms from the menu.
2. Sort by cost to identify the most expensive search terms first, as these have the biggest impact on your budget efficiency.
3. Review terms with zero conversions and significant spend, adding irrelevant queries as negative keywords to prevent future waste.
4. Identify high-performing search terms with strong conversion rates and create dedicated keywords targeting those exact phrases for better control and optimization.
Pro Tips
Review your search terms report weekly, not monthly. Irrelevant searches can burn through your budget quickly, and waiting a month to catch them means unnecessary waste. Set a recurring calendar reminder to spend fifteen minutes reviewing new search terms, adding negatives, and identifying opportunities. This small time investment typically saves more than any other optimization activity. If you’re not tracking marketing conversions properly, you won’t know which search terms actually drive results.
Putting It All Together: Your PPC Metrics Action Plan
Tracking metrics without taking action is just expensive reporting. The goal isn’t to become a data analyst—it’s to use these numbers to make smarter decisions that grow your business and protect your budget.
Start with conversion tracking. If you’re not accurately tracking phone calls, form submissions, and other valuable actions, every other metric is built on a shaky foundation. Get this right first, even if it means pausing optimization work for a week to implement proper tracking.
Once tracking is solid, focus on the profitability metrics: CPA and ROAS. These tell you whether your campaigns make financial sense. Everything else—CTR, Quality Score, impression share—matters only insofar as it impacts these bottom-line numbers.
Build a simple weekly review routine. Check your search terms report for waste. Review CPA by campaign to spot problems early. Monitor conversion rate changes that signal traffic quality shifts. Fifteen minutes of consistent weekly attention beats quarterly deep dives every time.
Remember that these metrics work together. Improving CTR boosts Quality Score. Better Quality Score reduces CPC. Lower CPC improves CPA. Better CPA enables higher ROAS. Focus on the weakest link in your chain rather than trying to optimize everything simultaneously.
The businesses that win with PPC aren’t the ones with the biggest budgets. They’re the ones who understand what their numbers mean and act on that understanding consistently. You now have the framework to join them.
Tired of spending money on marketing that doesn’t produce real revenue? We build lead systems that turn traffic into qualified leads and measurable sales growth. If you want to see what this would look like for your business, we’ll walk you through how it works and break down what’s realistic in your market.
Want More Leads for Your Business?
Most agencies chase clicks, impressions, and “traffic.” Clicks Geek builds lead systems. We uncover where prospects are dropping off, where your budget is being wasted, and which channels will actually produce ROI for your business, then we build and manage the strategy for you.